


What happened to gold on 3 September 2026? Gold moved higher and traded near the USD4,500 area after the market started to rethink the US interest-rate story. Fed Governor Christopher Waller’s comments were read as less aggressive, while the US dollar and Treasury yields eased a little. For Malaysian gold savers, the useful part is not just that gold went up. It is understanding why it moved, what the chart is showing, and how that global spot price looks once translated into Ringgit.
- Introduction
- What Happened To Gold On 3 September 2026?
- What Is The Gold Chart Showing?
- Why Did Gold Move This Way?
- What Does This Mean For Gold Savers?
- Conclusion
What Happened To Gold On 3 September 2026?
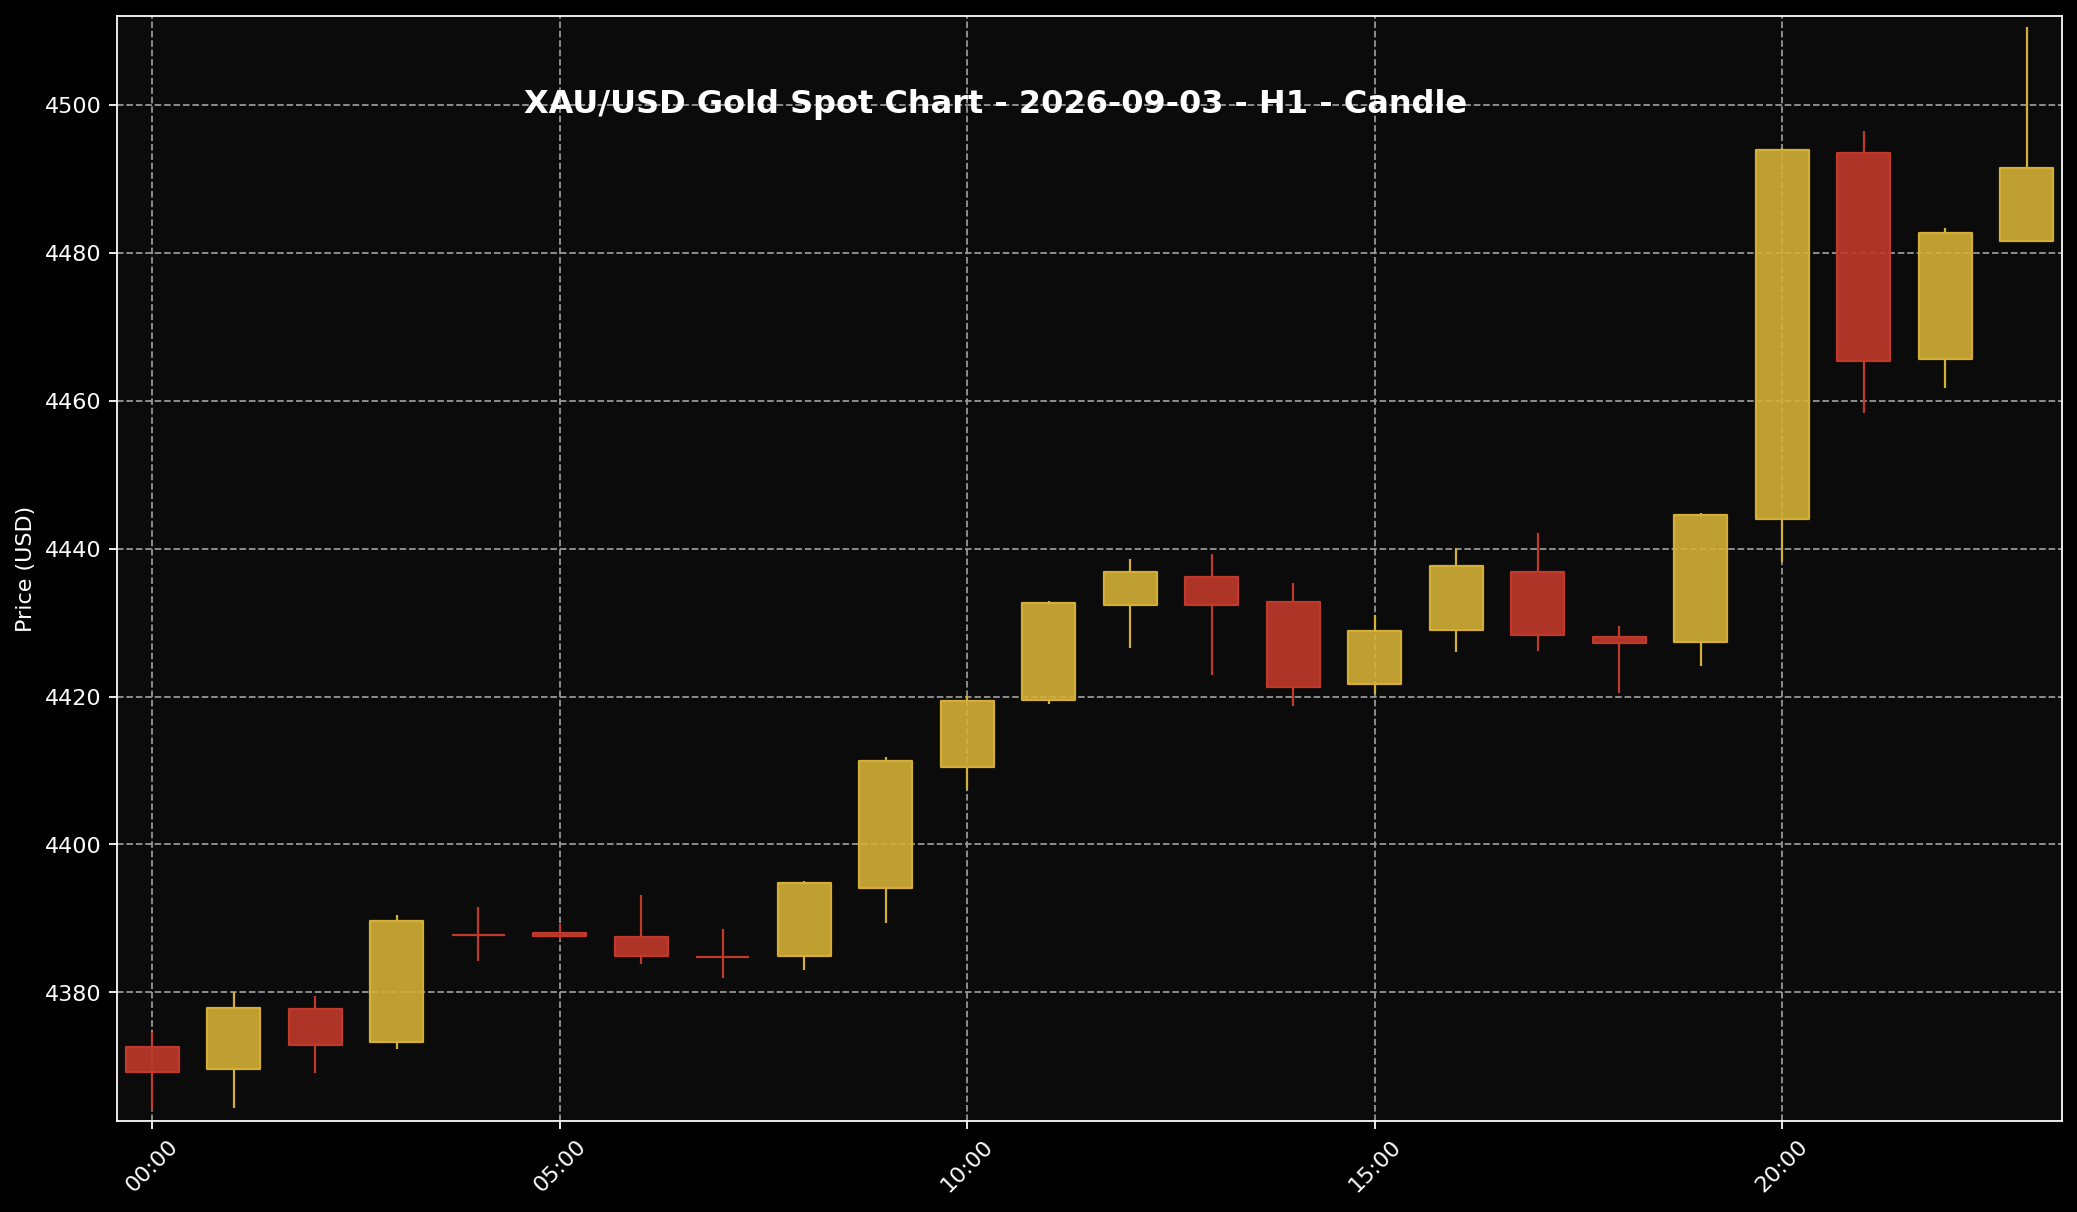 This chart shows the XAU/USD movement for the 3 September 2026 market session. Sifu Gold uses it as a visual reference, not a cue to buy emotionally.
1. On 3 September 2026, global gold traded stronger and moved close to the USD4,500 zone. The approved 11:00 PM Malaysia time snapshot placed XAU/USD around USD4,491.44 per troy ounce. In gram terms, that works out to about USD144.40 per gram.
2. Using the USD/MYR reference of around 4.04263, that same global spot reference translates to roughly RM18,157.22 per troy ounce, or about RM583.77 per gram. This is the global spot price converted into Ringgit. It is not the same as the local physical gold retail price people may see in Malaysia.
3. The main story was quite clear. Gold found room to move higher because the market felt US rate pressure might not be as aggressive as feared earlier. When that pressure cooled a little, the US dollar and US Treasury yields eased too. That usually helps gold, because the pressure from interest-bearing assets becomes less intense.
What Is The Gold Chart Showing?
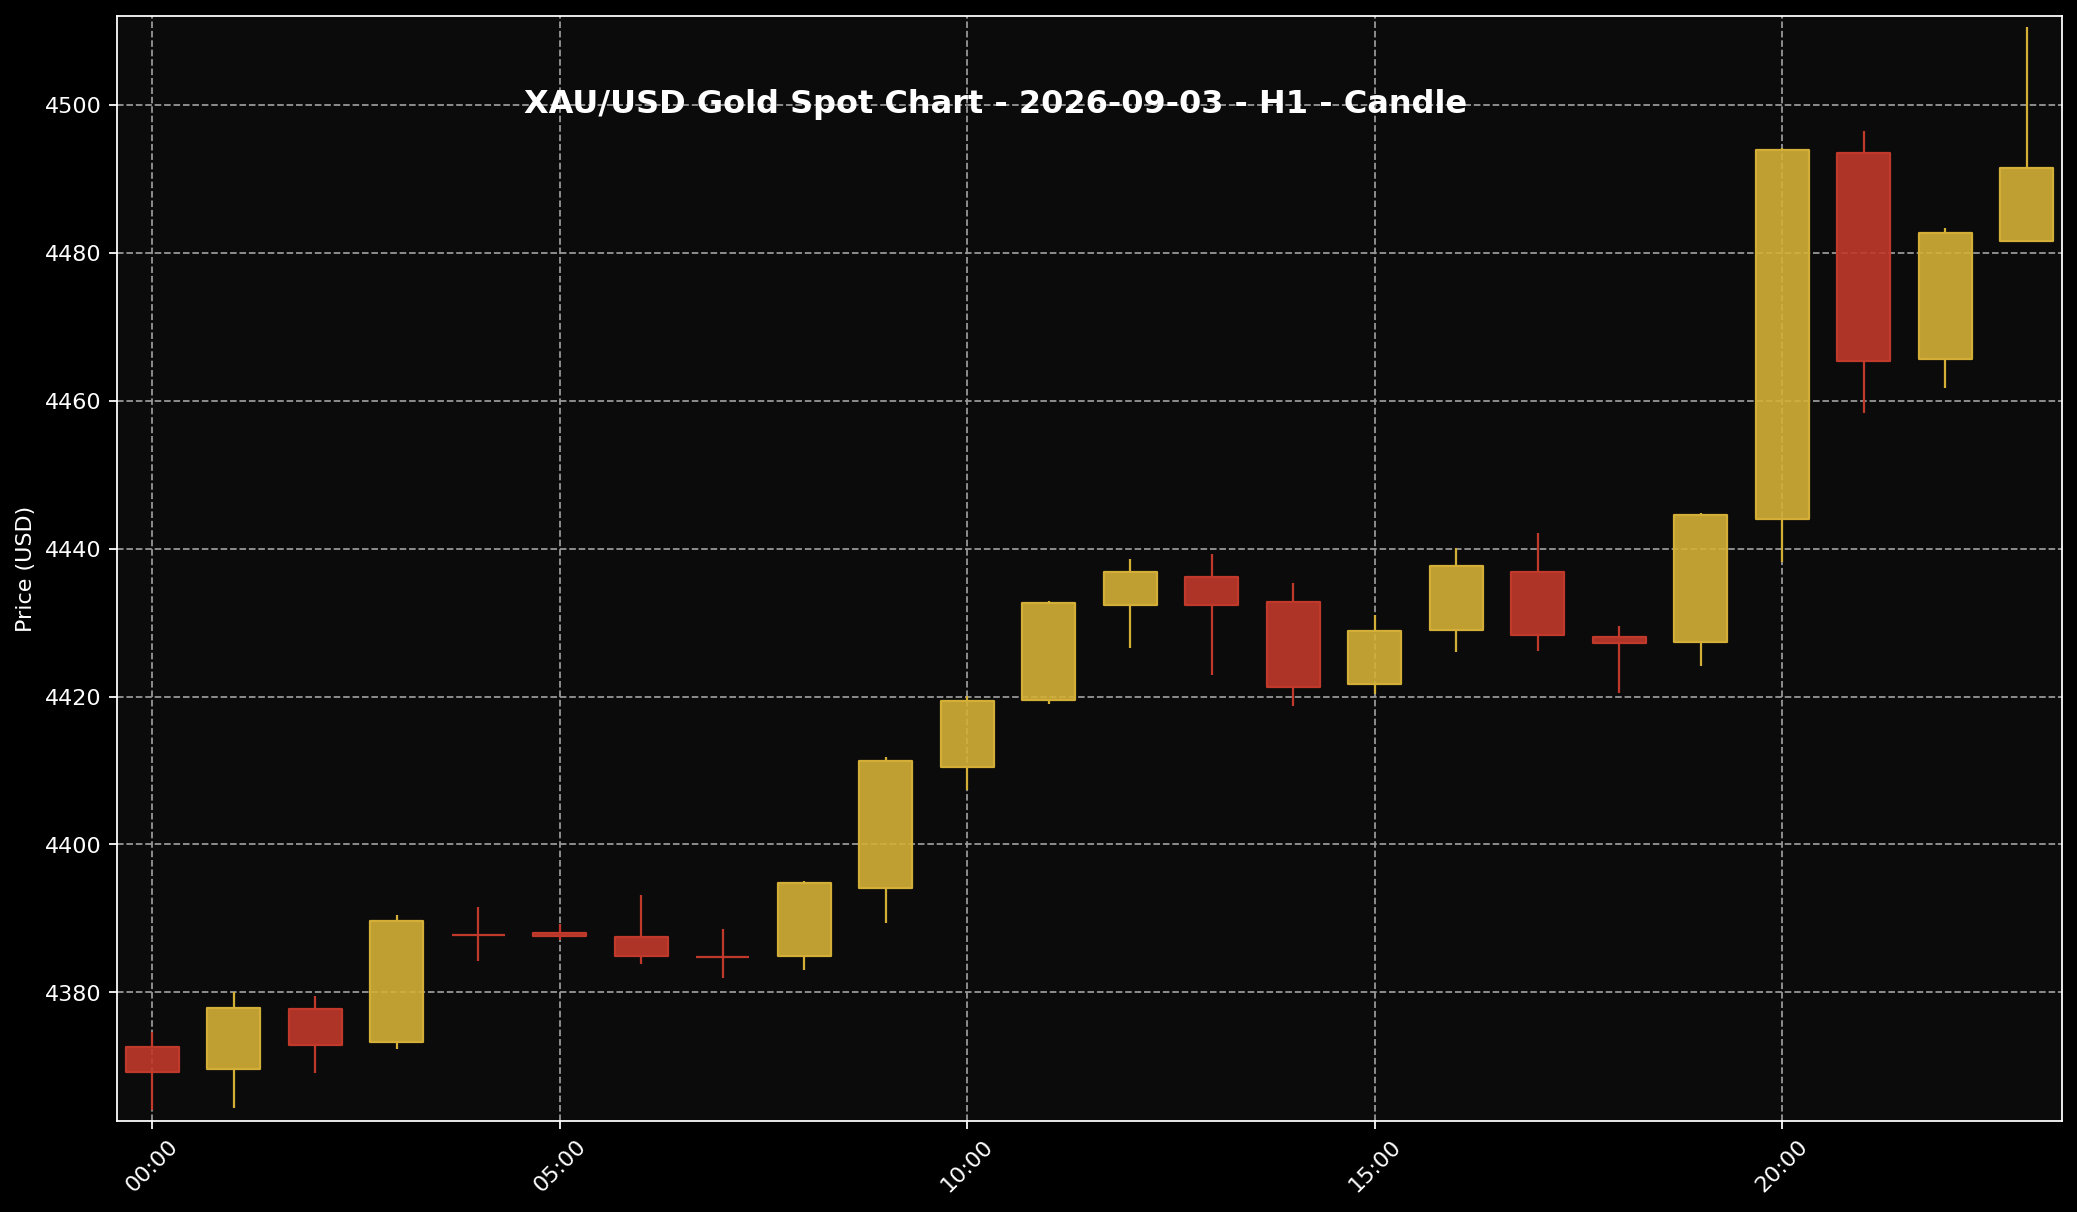 This chart helps readers see the gold price structure for the 3 September 2026 market session. It is used as market context and price-structure reference only.
1. If we look at the H1 gold chart for 3 September 2026, the movement was not flat. Gold climbed in stages from the lower area around USD4,370 before pushing closer to the USD4,500 region later in the session. Put simply, buyers were present, and the session had a clearer upward tone than a sideways one.
2. At the same time, the USD4,500 area still looked like a big zone for the market to test. Gold came close to it, but the candles also showed active back-and-forth movement. There were stronger upward candles, but also pullbacks after the rise. So the move looked positive, but not like a straight one-way climb.
3. For Sifu Gold readers, I would treat this chart as a simple market-structure guide, not a trading setup. The point is that gold was trying to hold near a higher area after getting support from the macro story. But the next direction still depended heavily on US jobs data, the US dollar and Treasury yields after that.
Why Did Gold Move This Way?
 The US dollar is often one of the key factors influencing gold prices. When the dollar is firmer, gold can face more noticeable pressure.
1. The clearest trigger came from the US interest-rate story. The market was watching whether the Federal Reserve still needed to stay aggressive, or whether softer labour-market signals could give it room to be less aggressive later. When Fed Governor Christopher Waller’s comments were read that way, traders started to reduce some of the rate pressure built into the market.
2. Why does that matter for gold? Gold does not pay interest like a bond. So when US bond yields are high, some investors prefer assets that give a return. But when yields ease, gold usually has more room to breathe. In simple terms, gold gets less pressure when the alternative that pays interest no longer looks as strong.
3. The market was also waiting for the bigger US jobs report, the nonfarm payrolls data. That matters because jobs data can quickly change how investors read the Fed’s next move. Stronger data can bring rate pressure back. Slower data can make the market think the Fed may not need to be as aggressive. That is why gold’s rise that day still needed to be read with some care.
What Does This Mean For Gold Savers?
 For Malaysian gold savers, the key point is to understand the gap between global spot price and local physical price, then act according to budget and discipline.
1. For Malaysian gold savers, this kind of daily move is useful as a check-in, not as a reason to chase the price emotionally. When gold moves near USD4,500, it tells us the market is revaluing the Fed, the US dollar and bond yields. That helps us understand the movement instead of only reacting to the headline number.
2. One thing is worth keeping clear. XAU/USD is the global spot reference, not the local physical gold price in Malaysia. The snapshot worked out to about RM583.77 per gram for global spot gold, but local physical pricing can differ because of USD/MYR, product premium, buy-sell spread, operating costs, logistics and local pricing structure.
3. From a practical angle, the better approach is to return to your own budget. If you already have a monthly gold-saving plan, small staged buying can still be considered based on affordability. If cash flow is tight, there is no need to force it. Do not commit the full budget at once just because gold moved higher for one day. The focus is building grams with discipline, not trying to catch the perfect price every time.
Conclusion
Gold on 3 September 2026 moved near the USD4,500 zone because the market was rethinking the Fed rate story, US jobs data, the dollar and Treasury yields. Waller’s comments were read as less aggressive, while yields eased a little, and that gave gold support. But because the bigger US jobs report was still ahead, this move should not be treated as a guaranteed direction. For Malaysian gold savers, the most useful takeaway is the link between global spot gold, USD/MYR and local physical pricing. If gold is part of a long-term saving plan, stay with the budget and build gradually when affordable. For those who are just starting, the Gold Accumulation Program by Public Gold allows gold saving from as low as RM100, which can suit a step-by-step approach based on personal affordability.

