


What happened to gold on 4 September 2026? Gold was hit after the US jobs data came in stronger than expected. That one report changed the mood quite quickly. The market started to think the Federal Reserve might still have room to keep interest rates high, or stay more aggressive if the data keeps supporting that view. That brought the US dollar and US Treasury yields back into the story. For Malaysian gold savers, the useful part is not just that gold fell. It is understanding why it moved, and what that global price looks like once we translate it into Ringgit.
- Introduction
- What Happened To Gold On 4 September 2026?
- What Is The Gold Chart Showing?
- Why Did Gold Move This Way?
- What Does This Mean For Gold Savers?
- Conclusion
What Happened To Gold On 4 September 2026?
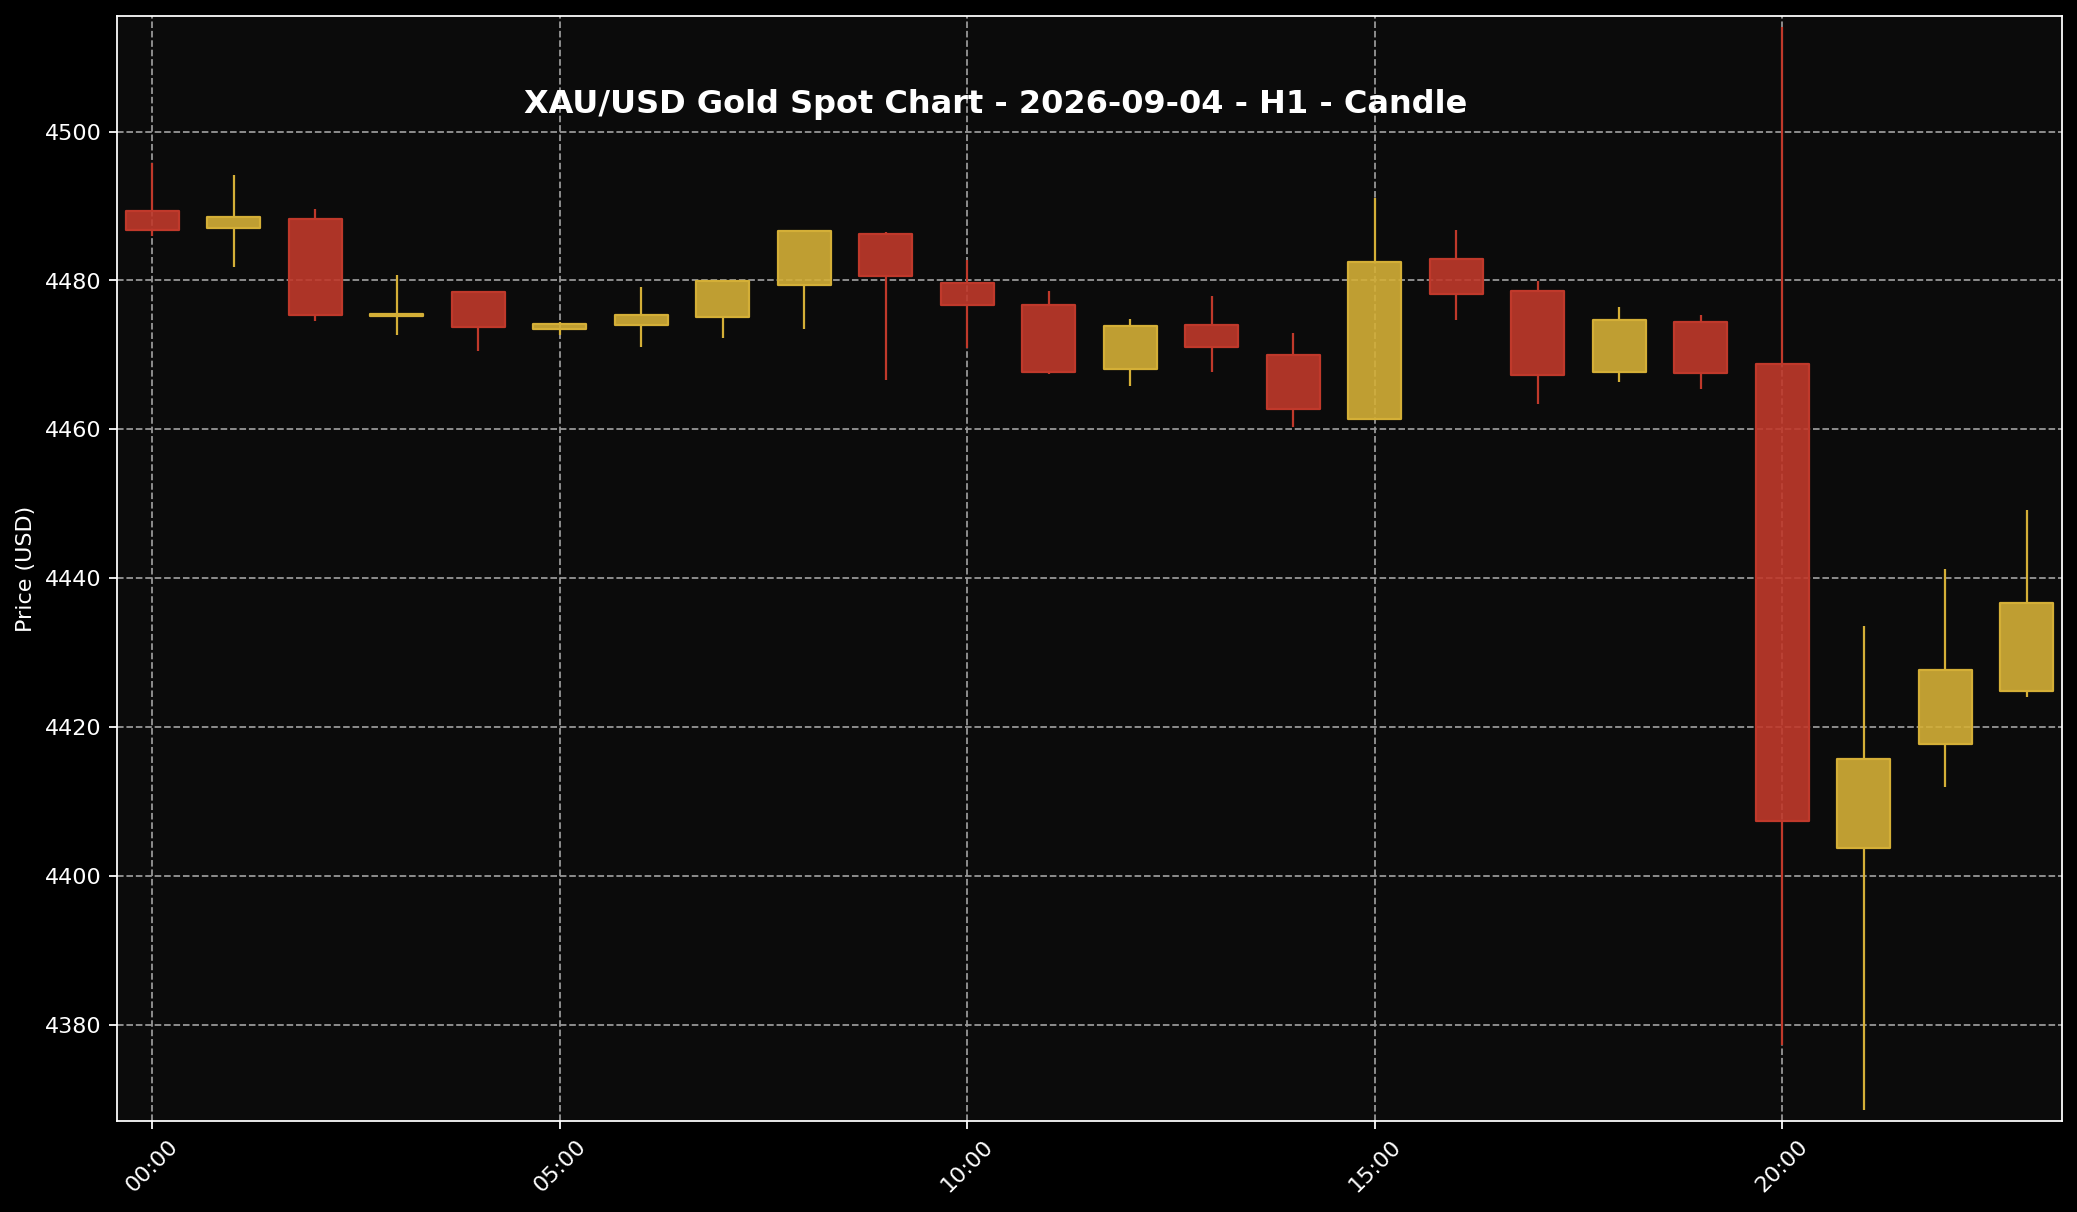 This chart shows the XAU/USD movement for the 4 September 2026 market session. Sifu Gold uses it as a visual reference, not a cue to buy emotionally.
1. On 4 September 2026, global spot gold was around USD4,436.64 per troy ounce at the 11:00 PM Malaysia time snapshot. In gram terms, that was about USD142.64 per gram. Based on USD/MYR around 4.04442 at the same snapshot, the global spot value was roughly RM17,943.64 per troy ounce, or about RM576.90 per gram. These Ringgit numbers are global spot conversions, not local physical retail gold prices in Malaysia.
2. The pressure came after the August US jobs report showed 162,000 jobs were created, stronger than the market expected. That made gold drop quickly during the early reaction. Put simply, when the US economy still looks strong, the market tends to think the Fed may not need to soften its interest-rate stance too quickly.
3. So the story was not random. Strong jobs data brought the Fed rate story back into focus. Then the US dollar and US Treasury yields became less friendly for gold. Gold did recover part of the fall later, but the main message of the day was still clear: gold was pressured first, then tried to rebuild some ground.
What Is The Gold Chart Showing?
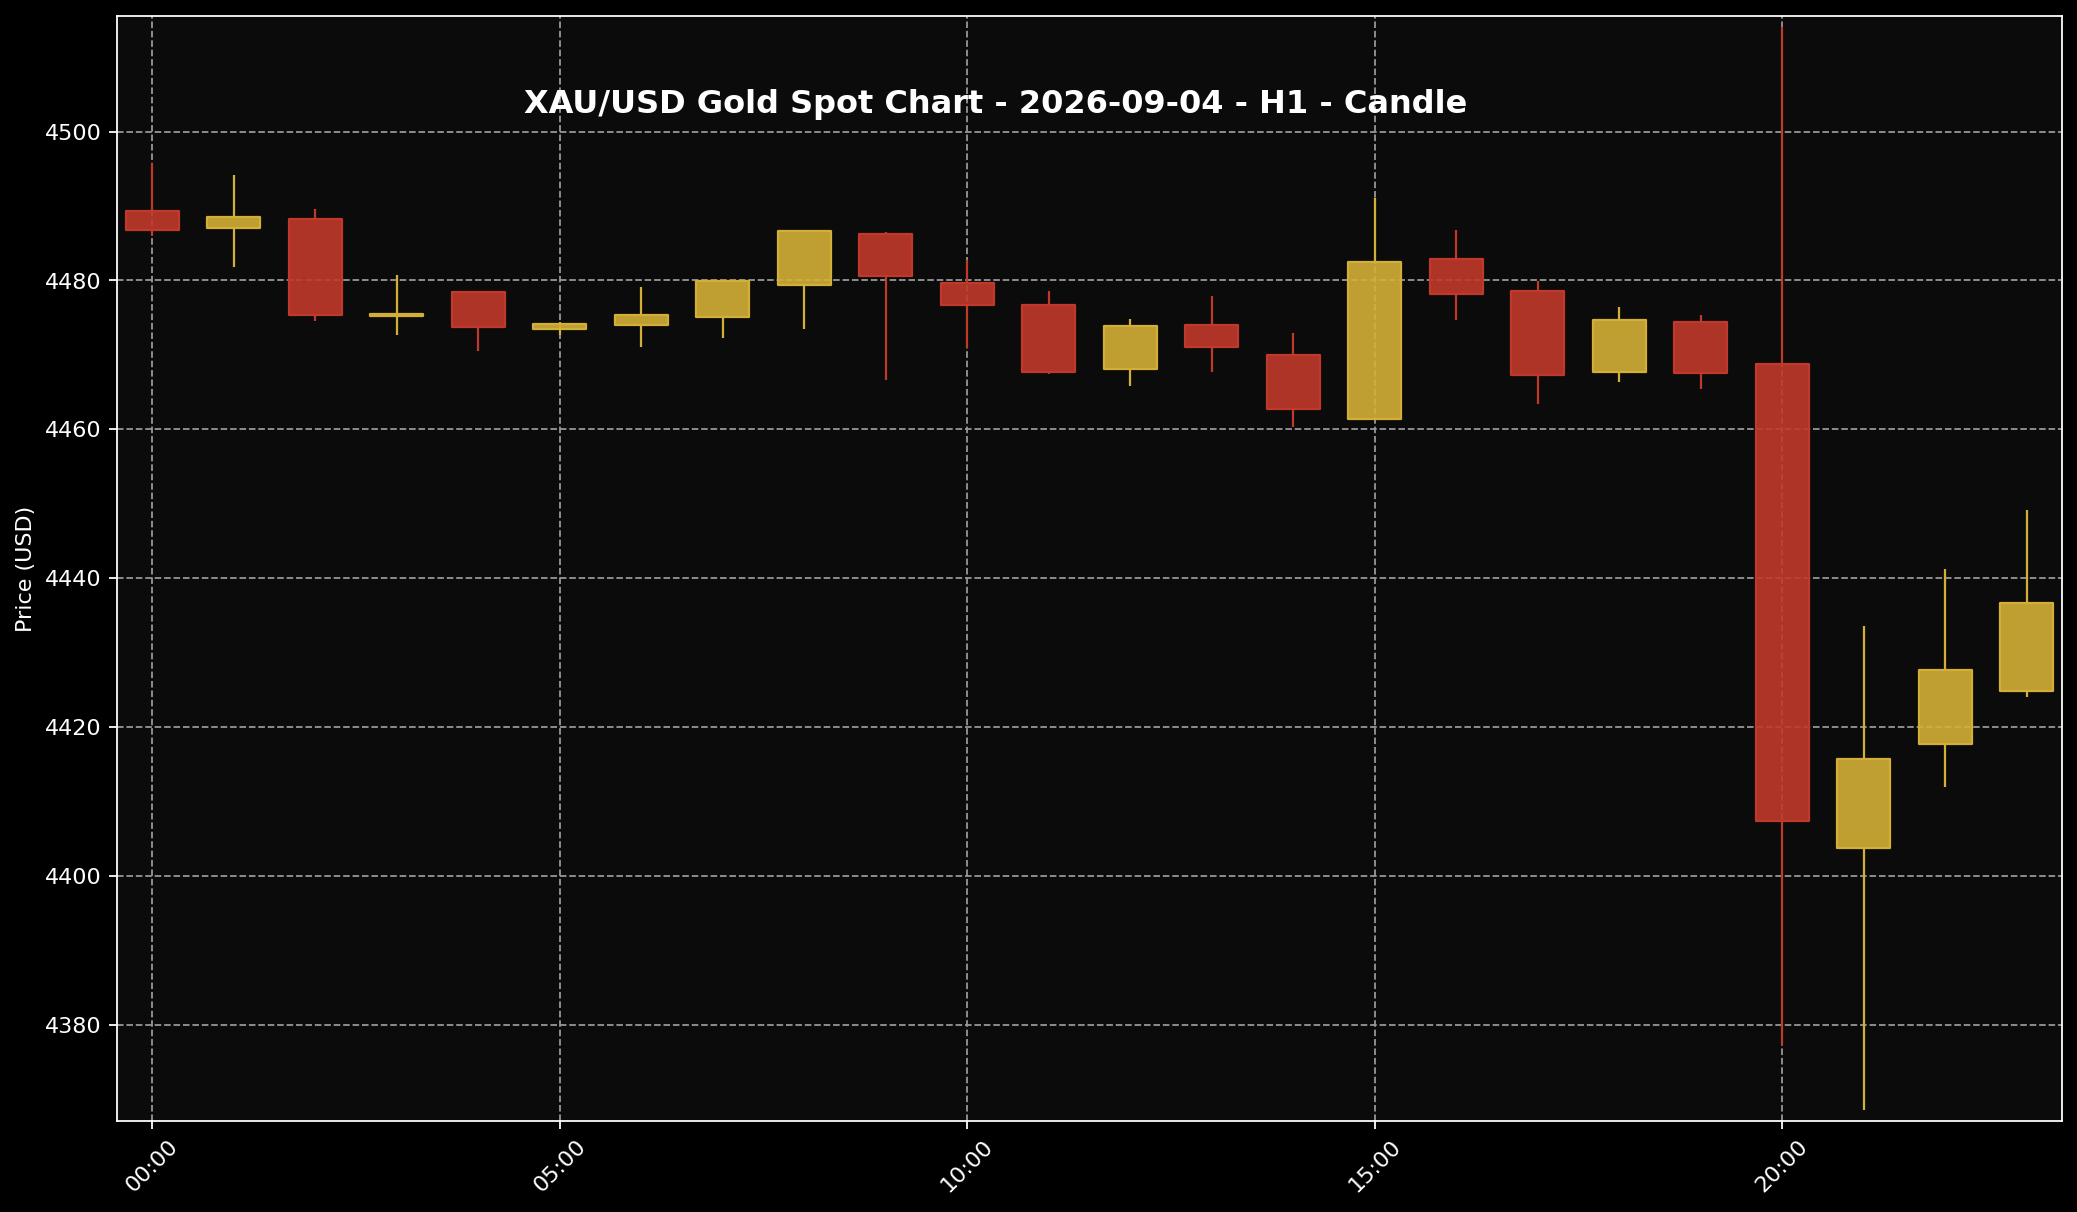 This chart helps readers see the gold price structure for the 4 September 2026 market session. It is used as market context and price-structure reference only.
1. If we look at the H1 gold chart for 4 September 2026, the early part of the session still looked fairly strong. Gold moved near the upper area of the day and at one stage reached around USD4,514.11. That tells us the market did not begin the day looking weak from the start. The bigger change only came once the US data shifted the mood.
2. After the jobs data, the chart showed a sharp selloff. Gold dropped towards the low area around USD4,368.53 before recovering part of that move. This is why the chart should not be read as a clean upward day. It was more like this: gold looked better earlier, got hit by the macro trigger, then tried to recover into the later snapshot around USD4,436.64.
3. The safer reading is mixed-to-negative. There was a rebound after the selloff, so buyers did not disappear completely. But the pressure from the US jobs data, Fed expectations, US dollar and yields was still the main driver. For readers who are not traders, this chart is simply a way to understand market structure. It is not a buy or sell signal.
Why Did Gold Move This Way?
 The US dollar is often one of the key factors influencing gold prices. When the dollar is firmer, gold can face more noticeable pressure.
1. The key trigger was the stronger US jobs report. When jobs numbers come in above expectations, the market usually reads it as a sign that the US economy is still holding up. If the economy still looks strong, the Fed may have less reason to cut rates quickly. In this case, the market started to bring rate-hike risk back into the conversation.
2. When the US rate story turns tighter, two things matter a lot for gold: the US dollar and US Treasury yields. A stronger US dollar can make gold more expensive for buyers using other currencies. Treasury yields are the returns investors can get from US government bonds. When those returns rise, some investors may prefer bonds in the short term because gold does not pay interest or dividends.
3. That is the simple chain for the day: strong US jobs data, changed Fed expectations, firmer dollar and higher yield pressure, then gold struggled to hold its earlier strength. Later on, gold tried to claw back part of the loss as the market looked ahead to inflation data. But that did not erase the bigger point. The day was mainly shaped by the market rebuilding its Fed expectations after the jobs report.
What Does This Mean For Gold Savers?
 For Malaysian gold savers, the key point is to understand the gap between global spot price and local physical price, then act according to budget and discipline.
1. The way I see it at Sifu Gold, daily moves like this are useful as a check-in point. They help us understand why gold can move sharply even when our own plan is long-term saving. For Malaysian gold savers, the main question is not whether we can guess the lowest price of the day. The more useful question is whether our gold-saving plan still fits our budget and purpose.
2. One thing to keep clear: global spot gold around RM576.90 per gram is not the same as the local physical gold price someone may see in Malaysia. Local physical pricing can include USD/MYR movement, product premium, buy-sell spread, operating cost, logistics cost and the pricing structure of the product itself. So when global spot gold rises or falls, the physical price in Malaysia may not move exactly one-to-one.
3. If you already have a monthly budget for gold saving, a more disciplined approach is to split the purchase into smaller amounts according to affordability. Do not go in heavily all at once just because gold fell for one day. If cash flow is tight, check commitments, emergency savings and family needs first. Building grams over time works better when it is planned, not rushed by one market move.
Conclusion
In short, gold on 4 September 2026 was pressured mainly by stronger US jobs data. That report brought the Fed rate story back into focus, supported the US dollar and Treasury yields, and made gold fall sharply before it recovered part of the move later in the session. For Malaysian gold savers, I would treat this as a useful reminder to review the plan properly. Look at the global spot price, translate it into Ringgit, and remember that local physical gold pricing has its own layers. If the budget is already set, gradual buying can still fit a long-term saving plan. If the budget is not ready, it is better to sort that out first. For those just starting, the Gold Accumulation Program by Public Gold allows gold saving from as low as RM100, which can suit a step-by-step approach based on your own ability.

