


What happened to gold on 15 September 2026? It pushed up towards USD4,318 early in the session, then dropped to around USD4,260 before buyers stepped back in. By 11:00 PM Malaysia time, gold had recovered to nearly USD4,290. The main pressure came from high oil prices, renewed inflation worries and growing expectations that US interest rates could rise. For Malaysian gold savers, this was a useful reminder that one sharp intraday move does not have to change a long-term saving plan.
- Introduction
- What Happened To Gold On 15 September 2026?
- What Is The Gold Chart Showing?
- Why Did Gold Move This Way?
- What Does This Mean For Gold Savers?
- Conclusion
What Happened To Gold On 15 September 2026?
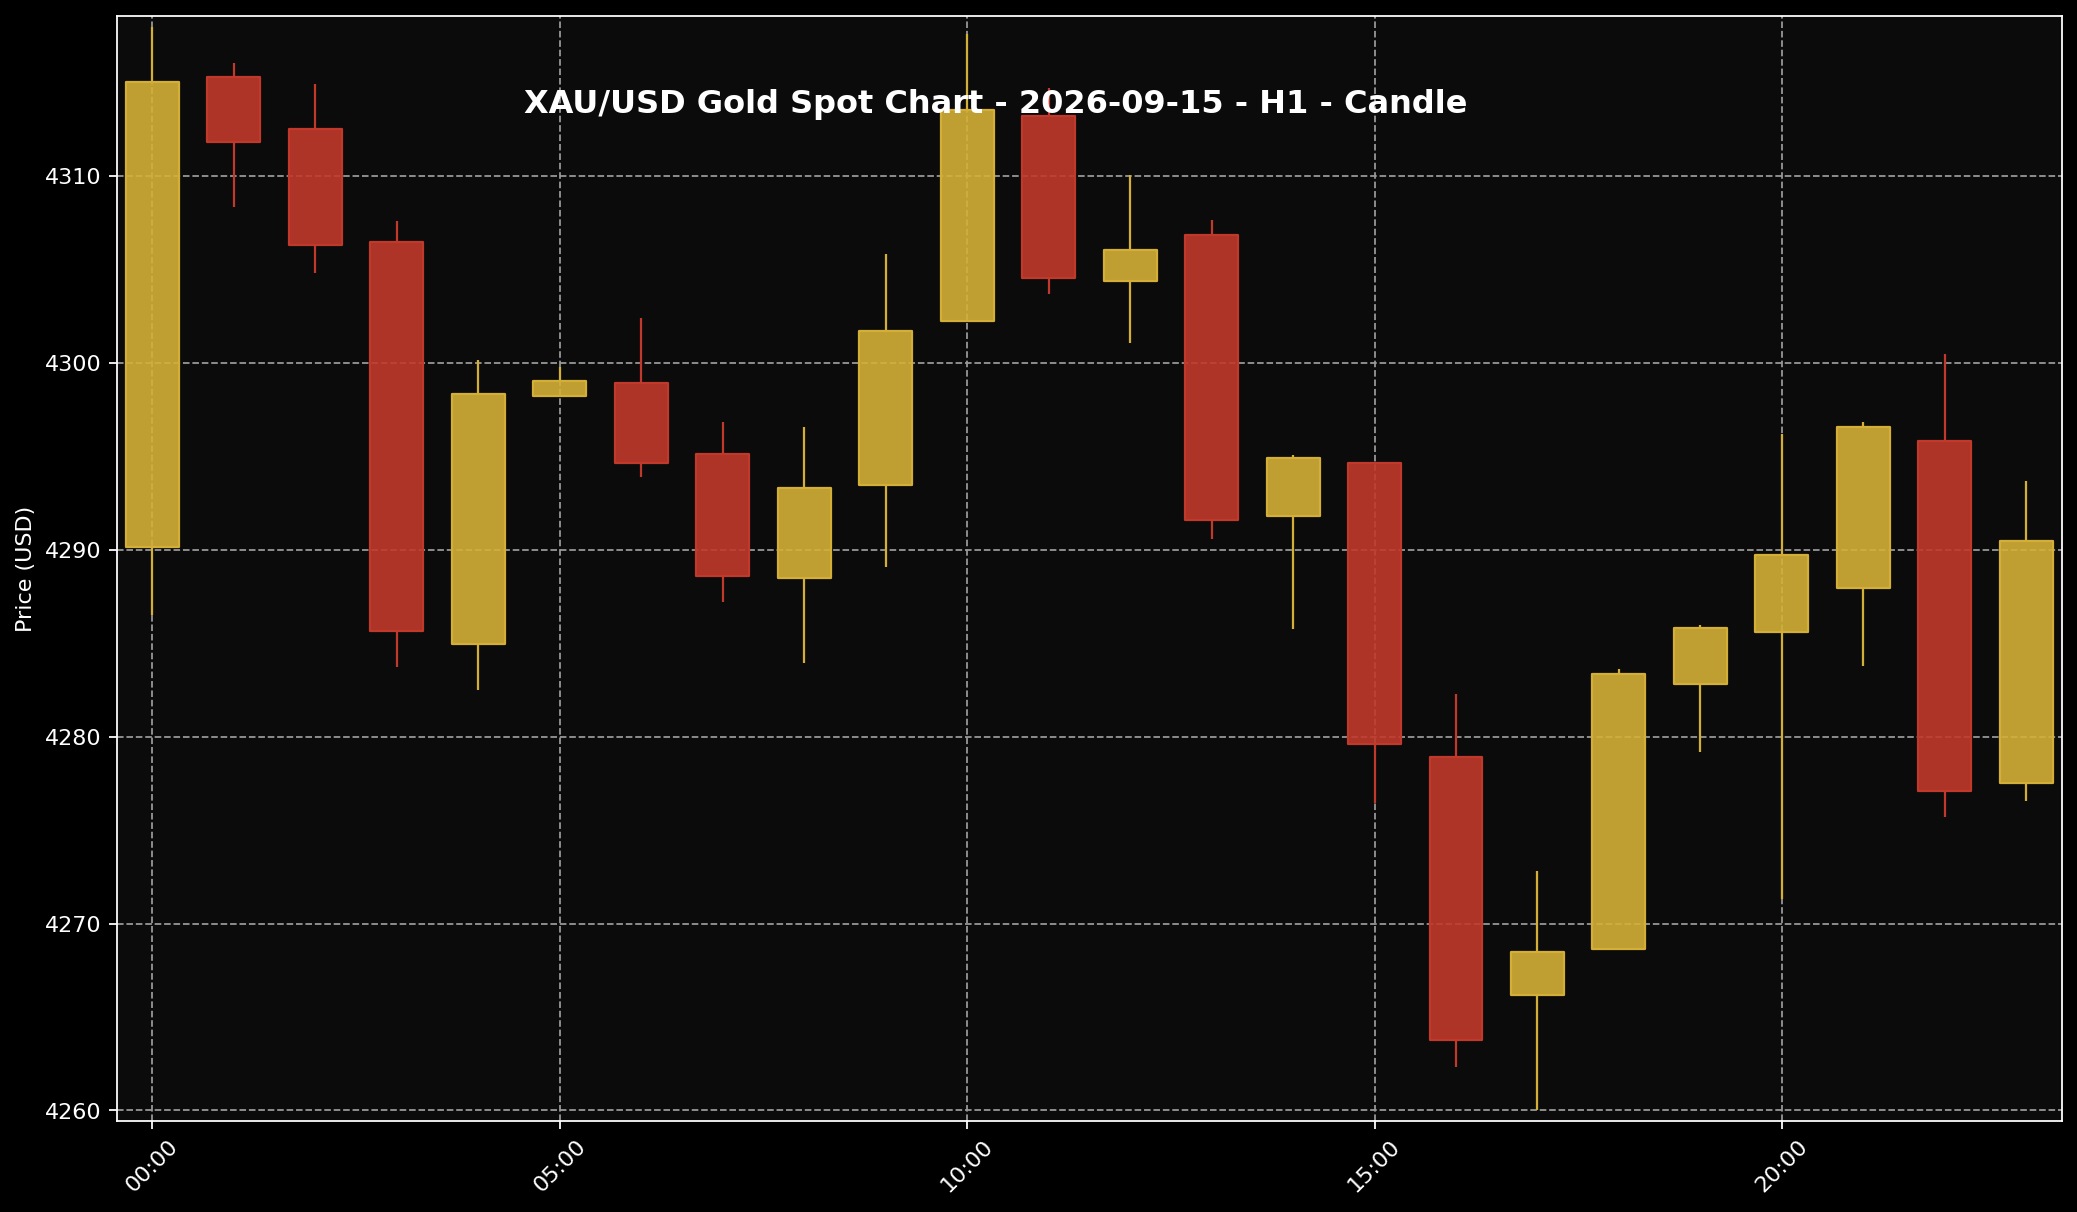 This chart shows the XAU/USD movement for the 15 September 2026 market session. Sifu Gold uses it as a visual reference, not a cue to buy emotionally.
1. At around 11:00 PM Malaysia time, global gold was trading at USD4,290.47 per troy ounce, or roughly USD137.94 per gram. With USD/MYR at 4.04688, that worked out to about RM17,363.00 per troy ounce or RM558.23 per gram. These Ringgit figures are conversions of the global spot price. They are not local physical gold retail prices in Malaysia.
2. Looking at the full session, gold did not simply fall from start to finish. It climbed briefly to around USD4,317.98 before selling pressure pulled it down to about USD4,260.03. Buyers then returned, taking the price back towards USD4,290 by the time of the snapshot. That was very close to the opening area of around USD4,290.13.
3. So there were two sides to the day. The intraday fall was clear, but gold did not stay near its lowest point. The late recovery showed that some buyers were willing to step in after the drop. Even so, one rebound was not enough to confirm a new direction while concerns about US interest rates and high Treasury yields were still hanging over the market.
What Is The Gold Chart Showing?
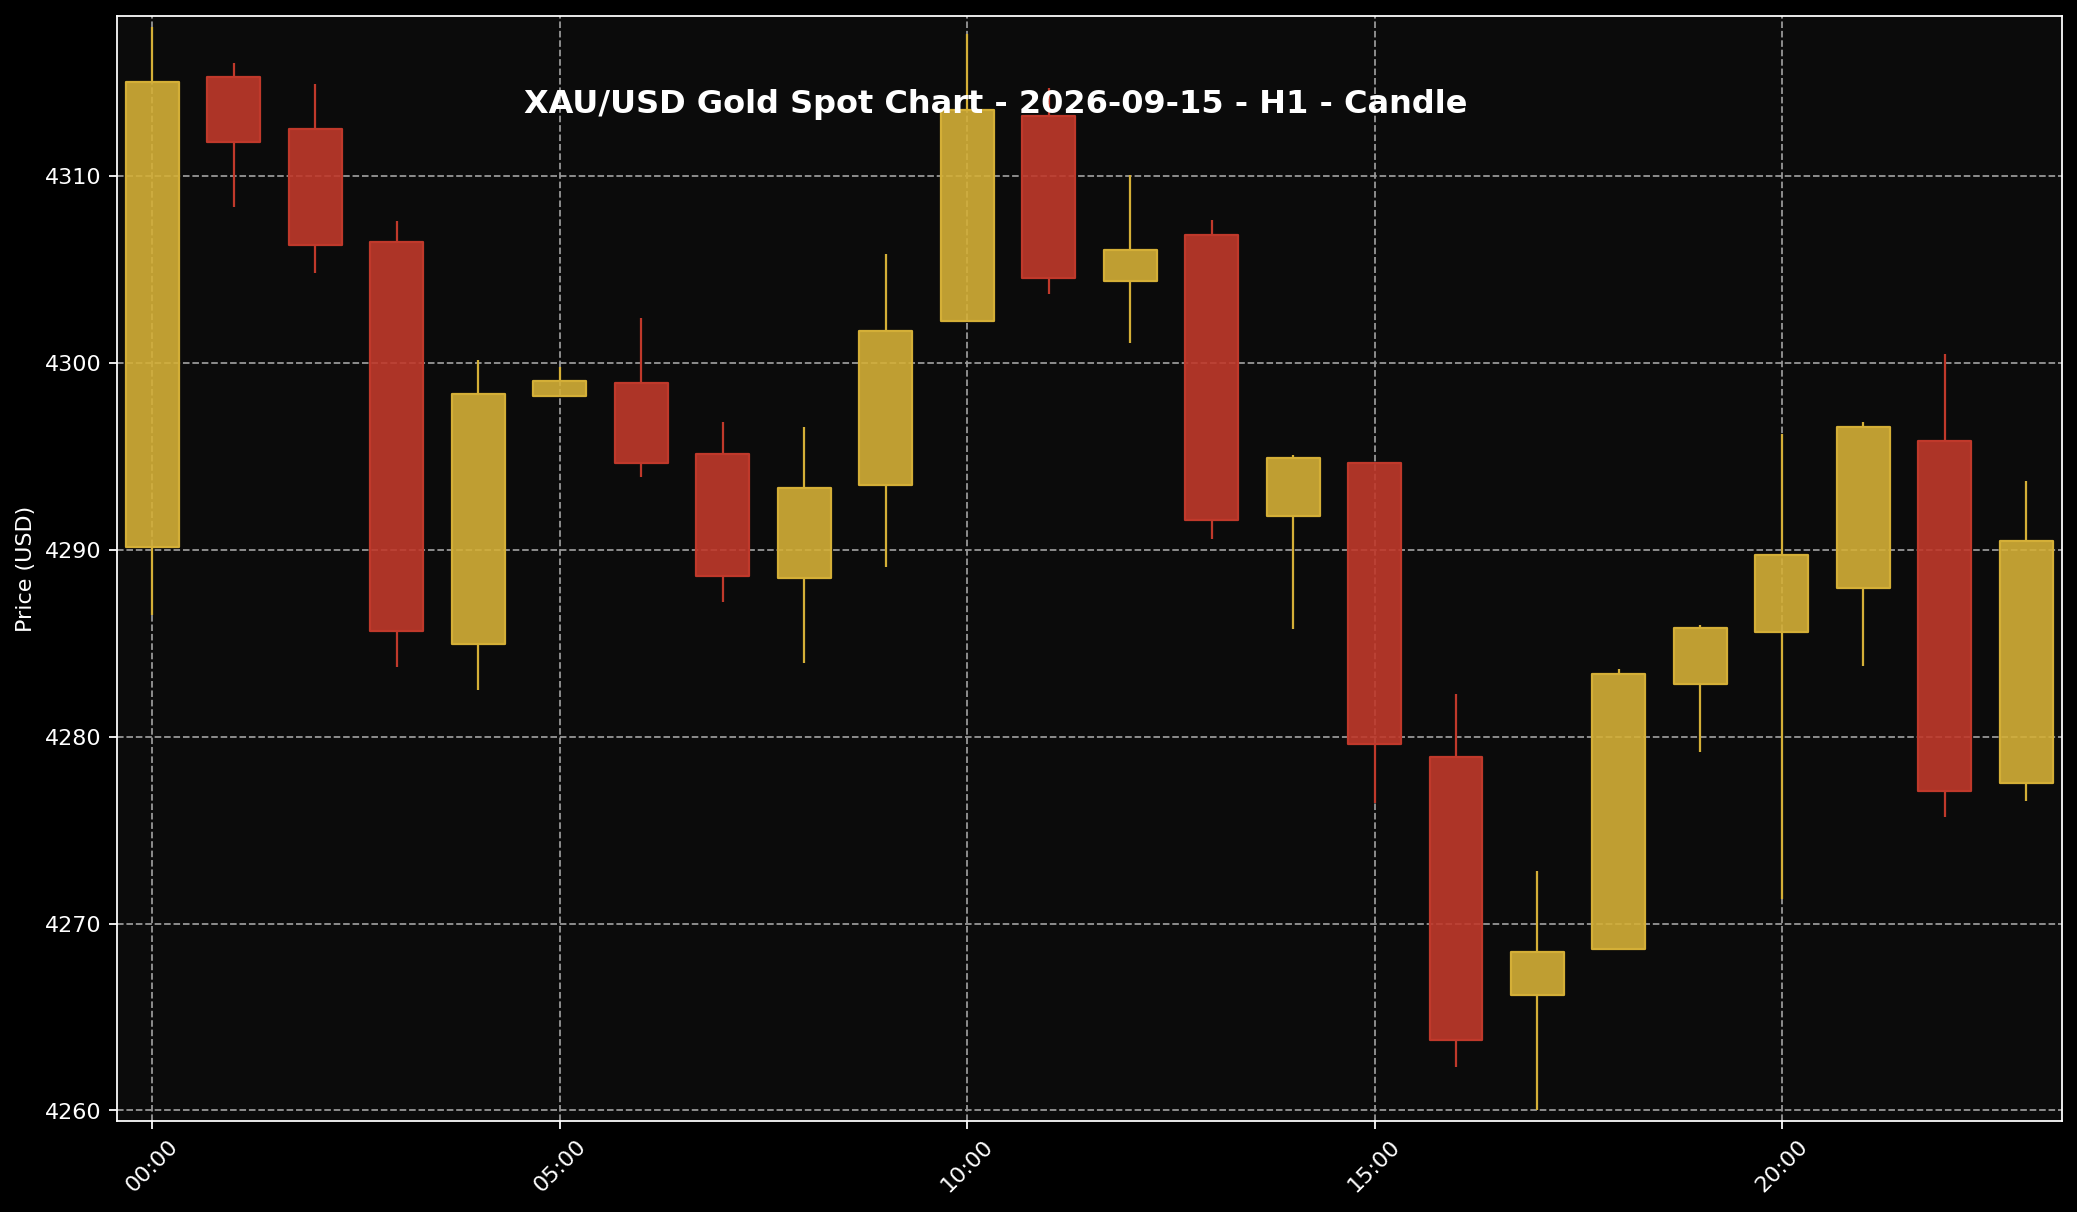 This chart helps readers see the gold price structure for the 15 September 2026 market session. It is used as market context and price-structure reference only.
1. The H1 chart, where each candle represents one hour, shows a fairly wide move during the session. Gold began near USD4,290 and made several attempts to move above USD4,310. Those attempts did not last. The price then turned lower, with selling becoming more noticeable during the afternoon in Malaysia.
2. The weakest part of the session came when gold reached the USD4,260 area. From there, the price began to recover in stages. It climbed back towards USD4,296, slipped again and then returned to nearly USD4,290 by 11:00 PM. Put simply, sellers controlled a large part of the day, but they could not keep gold close to the session low.
3. The USD4,260 and USD4,318 areas are better viewed as places where momentum changed during that particular session. They are not suggested buying prices or targets. The late recovery also does not confirm a longer-term change in trend. The chart only tells us that selling pressure eased after gold had fallen quite a long way from its earlier high.
Why Did Gold Move This Way?
 The US dollar is often one of the key factors influencing gold prices. When the dollar is firmer, gold can face more noticeable pressure.
1. The clearest pressure came from oil prices remaining high. When oil stays expensive, the market starts to worry that inflation may be harder to bring down. That strengthened expectations that the Federal Reserve could raise rates by 25 basis points, or a quarter of a percentage point. The Fed had only begun its two-day meeting, so this was still a market expectation rather than an announced decision.
2. US Treasury yields were also near multi-year highs, with the 10-year yield reported above 5%. A Treasury yield is simply the return investors can receive from holding US government bonds. When that return rises, bonds can look more attractive to some investors. Gold does not pay interest, so it often finds it harder to build momentum when bond returns are high.
3. There was weaker US manufacturing data as well, but it did not bring enough safe-haven demand to outweigh the pressure from rates and yields. Safe-haven demand is when investors turn to assets such as gold for protection during uncertain periods. Buyers did return after gold reached around USD4,260, but the wider concerns around oil, inflation and interest rates had not disappeared. That is why the recovery towards USD4,290 mattered without proving that the bigger pressure was over.
What Does This Mean For Gold Savers?
 For Malaysian gold savers, the key point is to understand the gap between global spot price and local physical price, then act according to budget and discipline.
1. The way I see it at Sifu Gold, a daily move like this is more useful as something to review than a reason to react emotionally. If the aim is to save gold for several years, one session that falls and then recovers does not automatically change that plan. The more useful question is whether the next purchase still fits your purpose and budget.
2. The RM558.23 per gram figure is a Ringgit conversion of the global spot price. The physical gold price paid in Malaysia can be different because it also reflects USD/MYR, product premiums, the buy-and-sell spread, operating costs, logistics and local pricing. It makes sense to check the actual product price and understand the spread before buying.
3. If you already have a separate gold-saving budget after looking after commitments and emergency savings, a small staged purchase may be considered. There is no need to commit the full budget at once simply because gold fell during one session. If cash flow is tight or the market still feels unclear, waiting is also a disciplined choice. Building grams within your means matters more than trying to catch the lowest price.
Conclusion
Gold came under pressure on 15 September 2026 as high oil prices added to inflation concerns, expectations for higher US interest rates grew and Treasury yields offered investors more attractive returns. The price dropped to around USD4,260 before buyers returned and brought it back towards USD4,290. That recovery was meaningful, but it did not show that the wider pressure from rates and yields had ended. For Malaysian gold savers, the focus remains on the actual price paid, the buy-and-sell spread and a comfortable monthly budget. If the budget is ready, building gold gradually can be more manageable than committing a large amount at once. If it is not, commitments and emergency savings come first. For those who prefer to build their gold holdings step by step, the Gold Accumulation Program by Public Gold allows you to begin saving gold from as little as RM100.

