


What happened to gold on 9 July 2026 was not a simple one-way rise. Early in the session, gold came under pressure as the market looked at Middle East tensions through the lens of inflation, the US dollar, and Treasury yields. But later on, the tone changed. Safe-haven demand returned, and gold managed to recover above USD4,100 by the close. For Malaysian gold savers, the more useful question is not just whether gold fell first and bounced later, but why that happened and what the same move looks like once it is translated into Ringgit.
- Introduction
- What Happened To Gold On 9 July 2026?
- What Is The Gold Chart Showing?
- Why Did Gold Move This Way?
- What Does This Mean For Malaysian Gold Savers?
- What Practical Action Makes More Sense?
- Conclusion
What Happened To Gold On 9 July 2026?
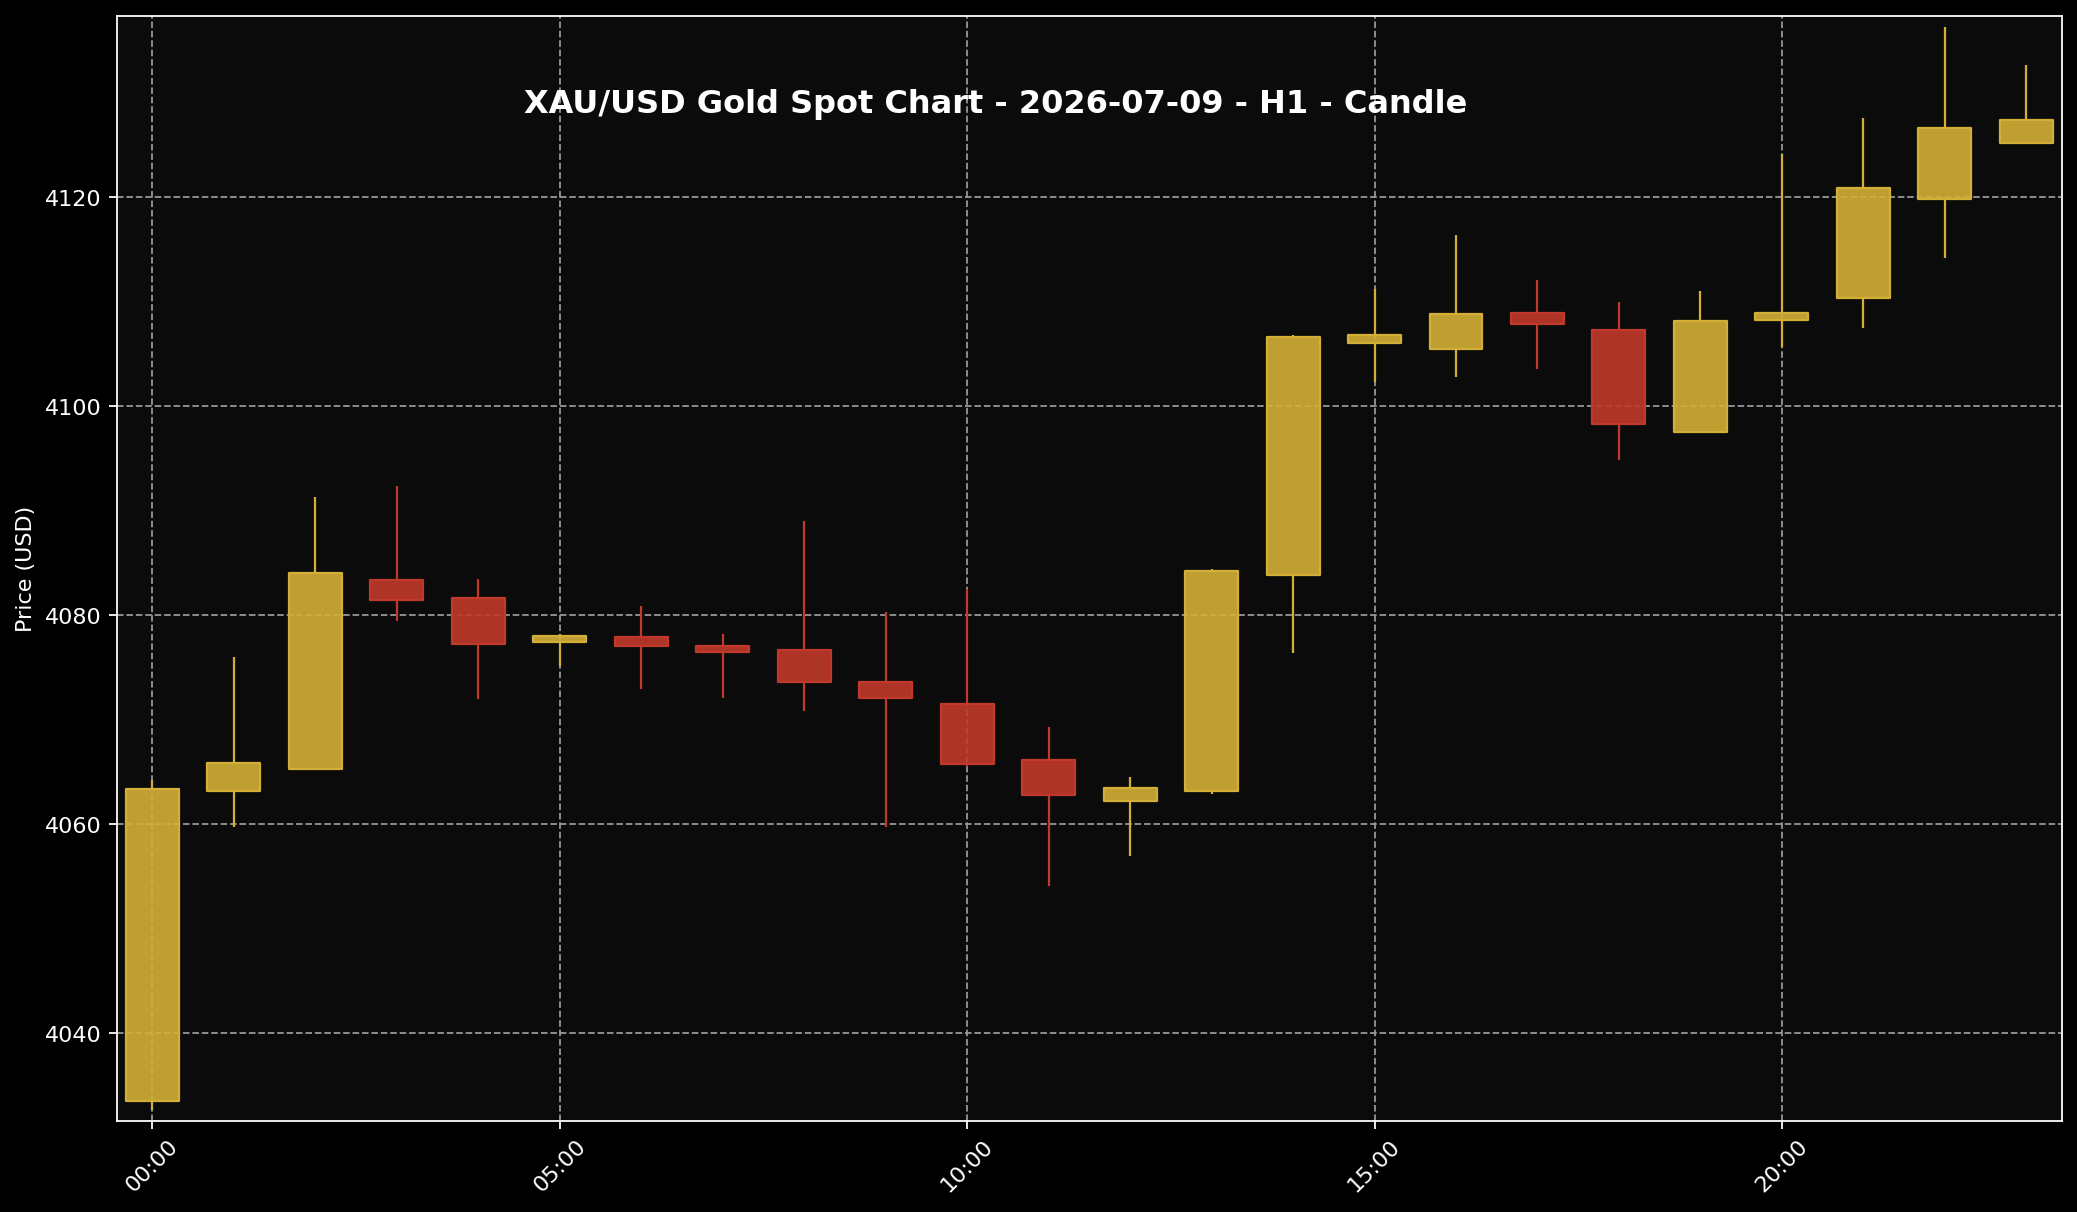 This chart shows the XAU/USD movement for the 9 July 2026 market session. Sifu Gold uses it as a visual reference, not a cue to buy emotionally.
1. By around 11:00 PM Malaysia time, global spot gold was near USD4,127.42 per troy ounce. That comes to about USD132.70 per gram. Using USD/MYR around 4.07714 at the same point, the same global spot price worked out to roughly RM16,828.07 per troy ounce, or about RM541.04 per gram. These Ringgit figures are global spot conversions, not local physical retail gold prices in Malaysia.
2. The bigger story is that gold did not move in a straight line. Earlier in the day, it slipped and briefly tested the USD4,054 area as the market grew more concerned about inflation pressure, firm Treasury yields, and a stronger US dollar. In simple terms, gold looked weaker first because traders were thinking about what renewed geopolitical tension could mean for prices, interest rates, and broader market risk.
3. But the session did not finish with that early weakness. Later on, gold recovered, moved back above USD4,100, and even reached the USD4,136 area before settling near USD4,127. So 9 July 2026 is better read as a pressured-then-rebound session. It was not a clean breakout into a new direction, but it was also not a session where sellers stayed fully in control.
What Is The Gold Chart Showing?
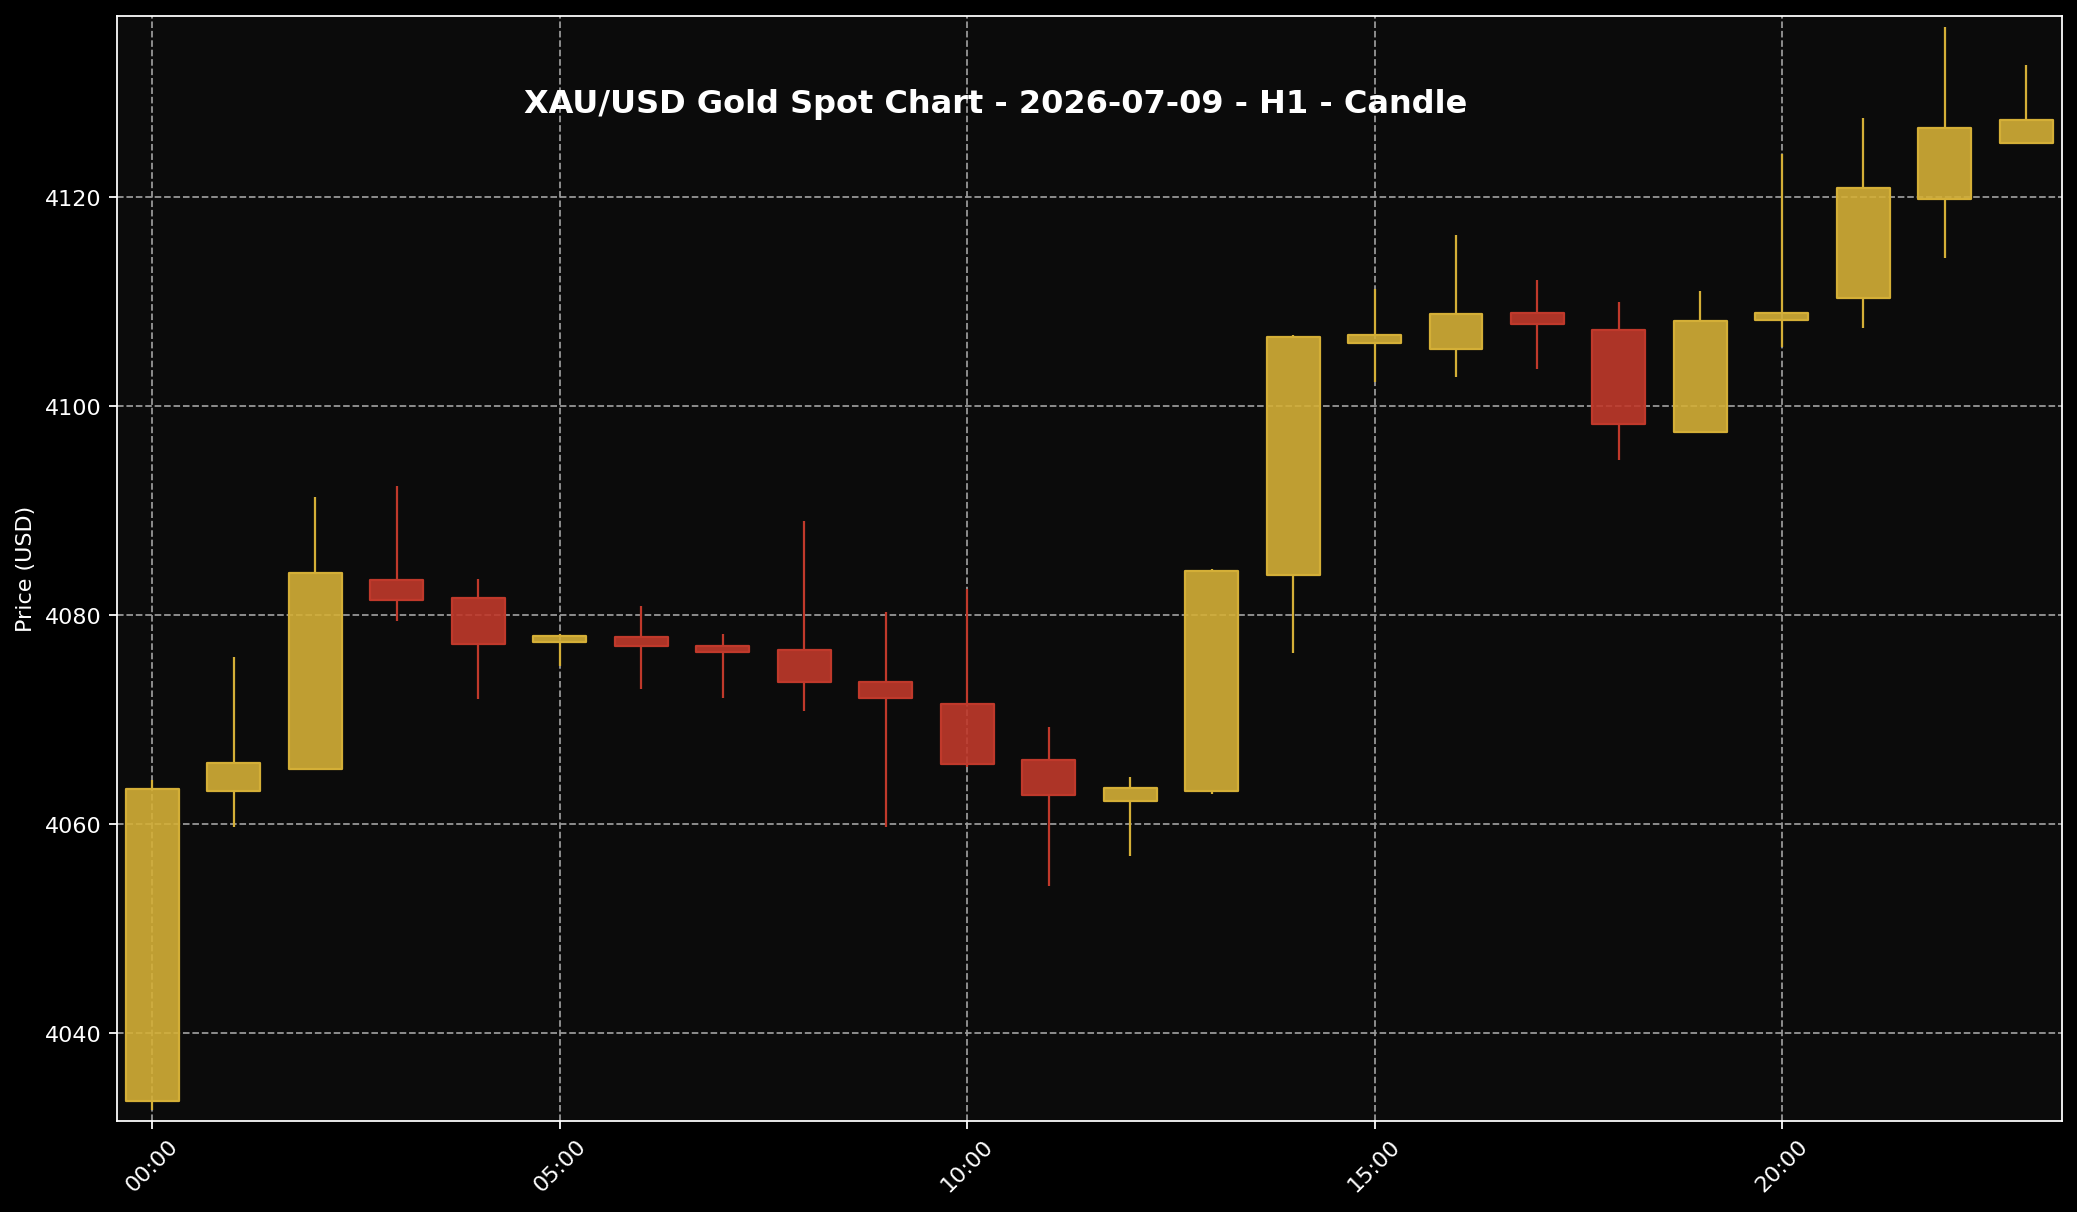 This chart helps readers see the gold price structure for the 9 July 2026 market session. It is used as market context, not as a trading signal.
1. If we look at the hourly chart, the session had two quite clear phases. First came the early pressure, with gold drifting lower and spending part of the day around the lower end of its intraday range. That fits the broader market mood at the time, where the US dollar and bond yields were still giving gold a hard time.
2. The second half of the chart looks very different. Gold found support, buyers came back in, and the price pushed up again into the close. The move back above USD4,100 matters because it shows the market had not lost interest in gold altogether. Even after the earlier drop, there was still enough demand to bring price back toward the upper part of the session range.
3. At the same time, the chart does not really say that gold has suddenly broken into a fresh, clear bullish phase. The simpler reading is better here: gold was hit first, then it recovered well. For Sifu Gold readers, that kind of chart reading is useful because it explains the shape of the day without turning it into a trading-style call.
Why Did Gold Move This Way?
 The US dollar is often one of the key factors influencing gold prices. When the dollar is firmer, gold can face more noticeable pressure.
1. The main trigger was the way Middle East tension fed into the market in two different stages. Early on, the market focused more on the inflation side of the story. When geopolitical stress raises concern about energy disruption or firmer oil prices, traders start to worry that inflation may stay sticky for longer. That was one of the main reasons gold came under pressure first rather than moving straight up.
2. Once that inflation concern rises, the next step is usually the US rate outlook. If inflation looks harder to bring down, the market may think the Federal Reserve will have less room to ease policy quickly. That tends to support the US dollar and Treasury yields. And when yields look more attractive, gold can lose momentum because it does not pay interest. Put simply, some money starts leaning towards yield-bearing assets before returning to gold.
3. Later in the session, the market looked at the same Middle East story from a different angle. Instead of focusing only on inflation risk, investors also turned back to gold’s safe-haven role. That helped gold recover. Weaker US existing home sales also added a bit of support later in the day. So the best explanation is not one headline or one factor on its own. Gold was pressured first by inflation-and-rates thinking, then lifted again as safe-haven demand came back into focus.
What Does This Mean For Malaysian Gold Savers?
 For Malaysian gold savers, the key point is not only whether prices rise or fall. What matters more is budget, discipline and a clear purpose.
1. For Malaysian gold savers, the first takeaway is that looking at gold in US dollars alone is never enough. Gold may recover in global terms, but what matters locally still depends on USD/MYR as well. That is why the Ringgit translation matters. Around RM541.04 per gram gives a more useful local reference for the same global move than the USD figure on its own.
2. Still, one thing needs to stay clear from the start: RM541.04 per gram here is only a converted global spot reference. It is not the same as a local physical gold selling price. Physical gold in Malaysia usually includes more layers, such as product premium, buy-sell spread, operating costs, logistics, and current local pricing structure. That is why spot gold and local physical prices do not move in a neat one-to-one way.
3. From my point of view at Sifu Gold, sessions like this are useful because they show how one global story can push gold in two directions within the same day. Early pressure does not always mean the market has turned fully negative, and a rebound does not always mean the pressure has disappeared. For local savers, the more helpful habit is to read the full context, then bring it back to Ringgit, budget, and long-term saving discipline.
What Practical Action Makes More Sense?
 When gold prices move quickly, better decisions usually come from disciplined planning, not panic reactions.
1. If you already have a monthly budget set aside for gold, a gradual approach still makes more sense than trying to guess the perfect bottom from a single day’s move. A session like 9 July 2026 is a good reminder that gold can look weak early on and very different again by the close. For long-term savers, building grams steadily is usually more useful than reacting too quickly to a few hours of price movement.
2. It also makes sense not to commit the full budget at once just because price dipped earlier in the session. Breaking purchases into smaller stages gives you more flexibility if the market stays choppy over the next few days. More importantly, gold saving should not come at the expense of household commitments, emergency savings, or monthly cash flow that still needs protecting.
3. If the market still feels mixed, waiting is also a disciplined choice. The next things worth watching are the US dollar, Treasury yields, inflation expectations, Middle East developments, and USD/MYR. For gold savers, the stronger long-term habit is usually not reacting fastest to one move, but staying consistent with a budget-led plan.
Conclusion
On 9 July 2026, gold came under pressure first as Middle East tension revived inflation worries and kept the market focused on the risk of higher-for-longer US rates. But the session did not end there. Safe-haven demand returned later, softer US housing data helped a little, and gold climbed back above USD4,100 by the close. For Malaysian gold savers, this is better read as a reminder that one global story can move gold in stages, not always in a straight line. That is why I still prefer to look at gold through the lens of saving discipline, Ringgit translation, and budget control rather than short-term excitement. If you already have a plan, keep building gradually. If you are only just starting, Gold Accumulation Program by Public Gold lets you begin saving gold from as little as RM100.

