


What happened to gold on 10 July 2026? At first glance, some readers may expect Middle East tension to push gold higher straight away. But that was not really how the market read it during this session. Gold still struggled to build stronger momentum because traders were also thinking about inflation, US interest rates, and firm Treasury yields. For Malaysian gold savers, the more useful question is not just whether gold rose or fell that day, but why the move looked mixed and what the same global price really means once it is translated into Ringgit.
- Introduction
- What Happened To Gold On 10 July 2026?
- What Is The Gold Chart Showing?
- Why Did Gold Move This Way?
- What Does This Mean For Malaysian Gold Savers?
- What Practical Action Makes More Sense?
- Conclusion
What Happened To Gold On 10 July 2026?
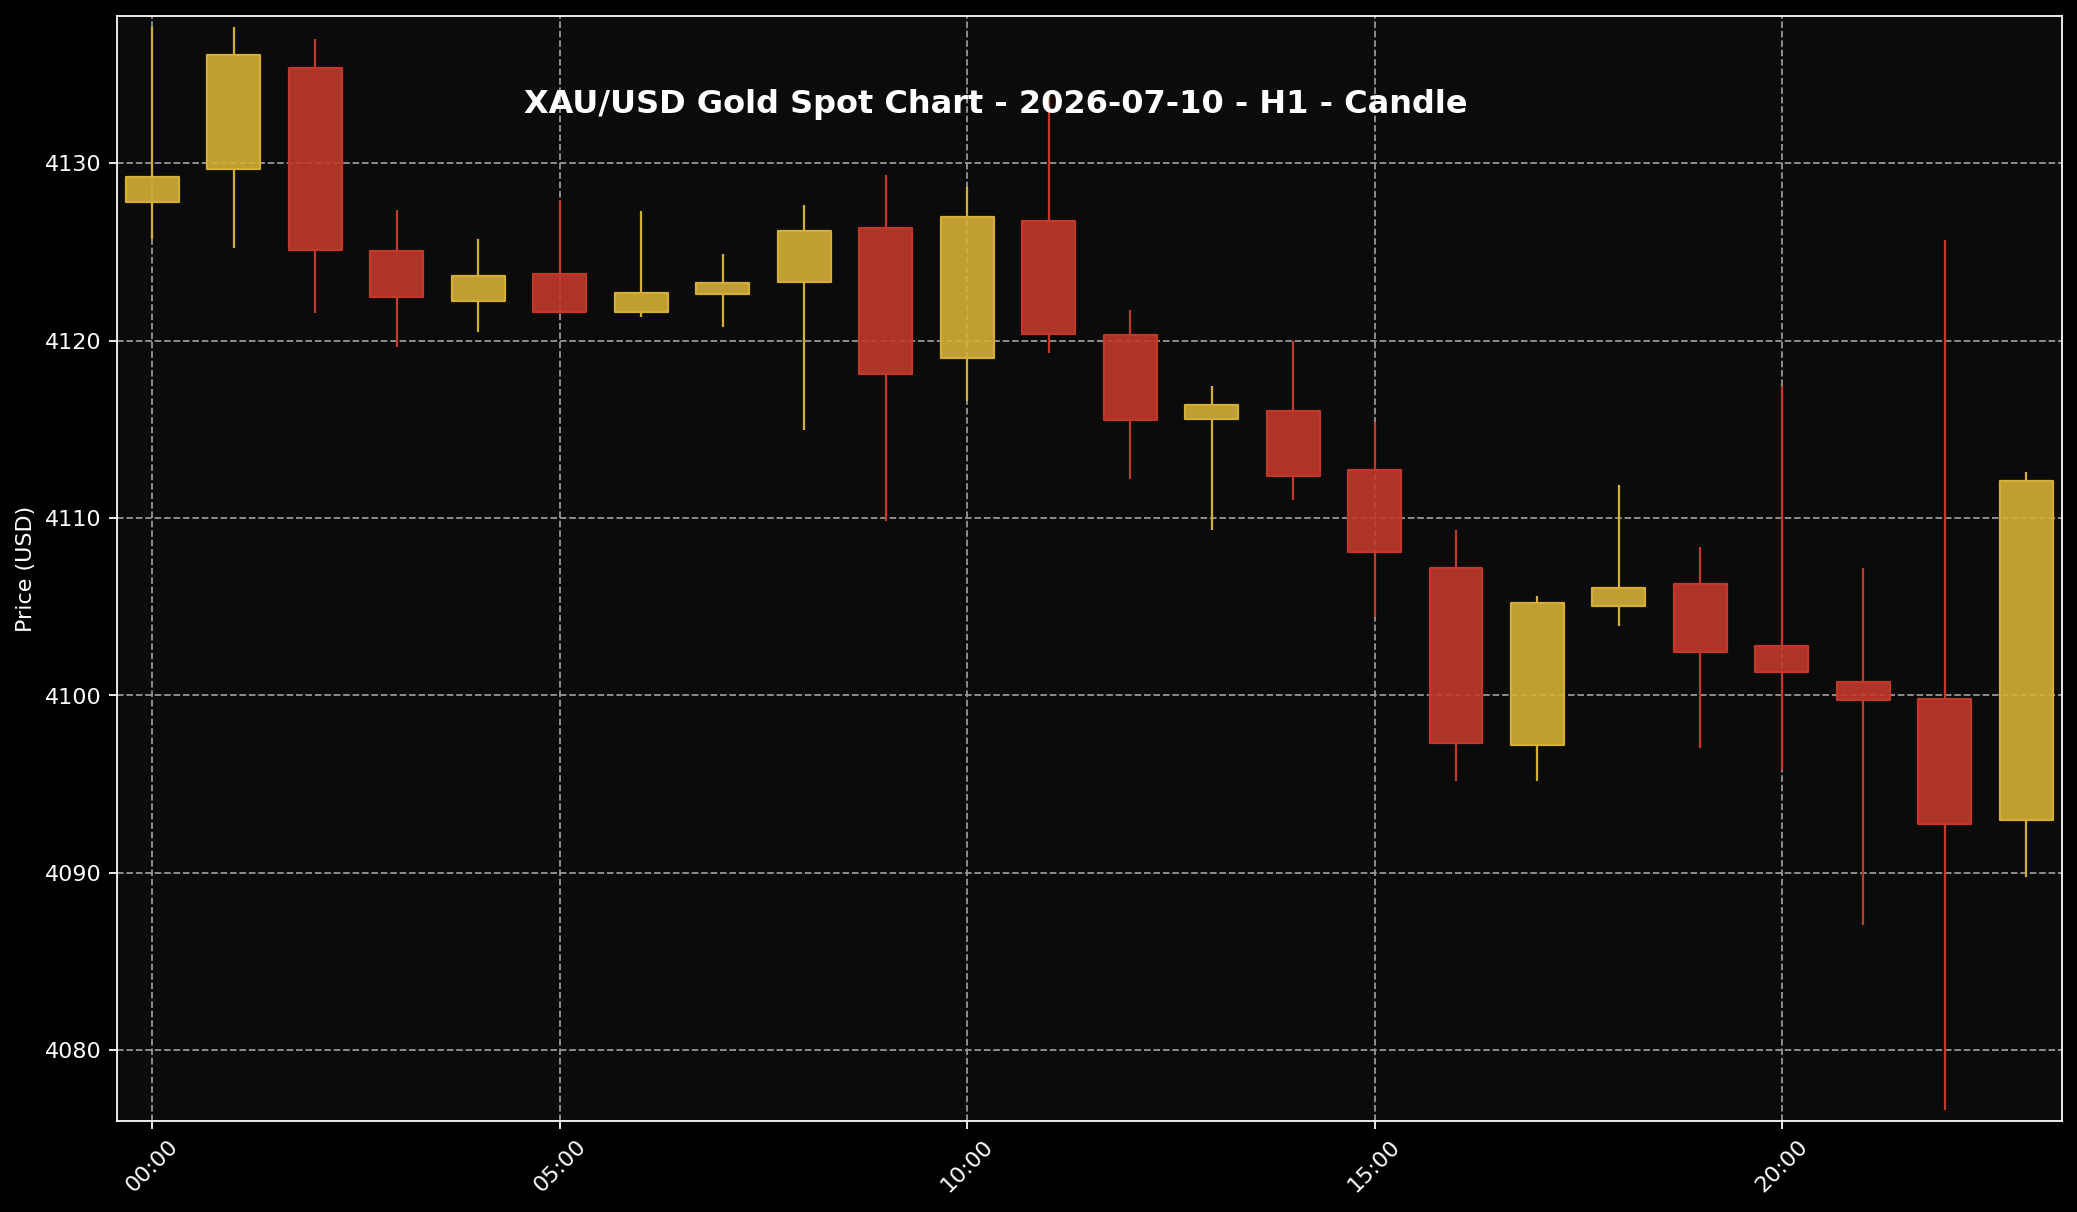 This chart shows the XAU/USD movement for the 10 July 2026 market session. Sifu Gold uses it as a visual reference, not a cue to buy emotionally.
1. At the approved closing reference around 11:00 PM Malaysia time, global spot gold was around USD4,112.10 per troy ounce. Broken down into grams, that came to about USD132.21 per gram. Using USD/MYR around 4.0708 at the same snapshot, that worked out to roughly RM16,739.52 per troy ounce or about RM538.19 per gram. These Ringgit figures are global spot conversions, not local physical retail gold prices in Malaysia.
2. The session itself was not a clean up day or a clear breakdown day. Gold came under pressure earlier on, and that kept the market looking cautious for much of the session. But by the close, it had recovered enough to finish near the top of its daily range. So the better way to read 10 July is this: gold was pressured first, then managed to steady itself again above the USD4,100 area.
3. For Sifu Gold readers, that matters because it shows two things at once. Buyers had not disappeared, but the market still did not have a strong enough reason to push gold into a much clearer upward move. In other words, this was still a market that looked careful and slightly constrained, rather than one that had already turned confidently in a fresh direction.
What Is The Gold Chart Showing?
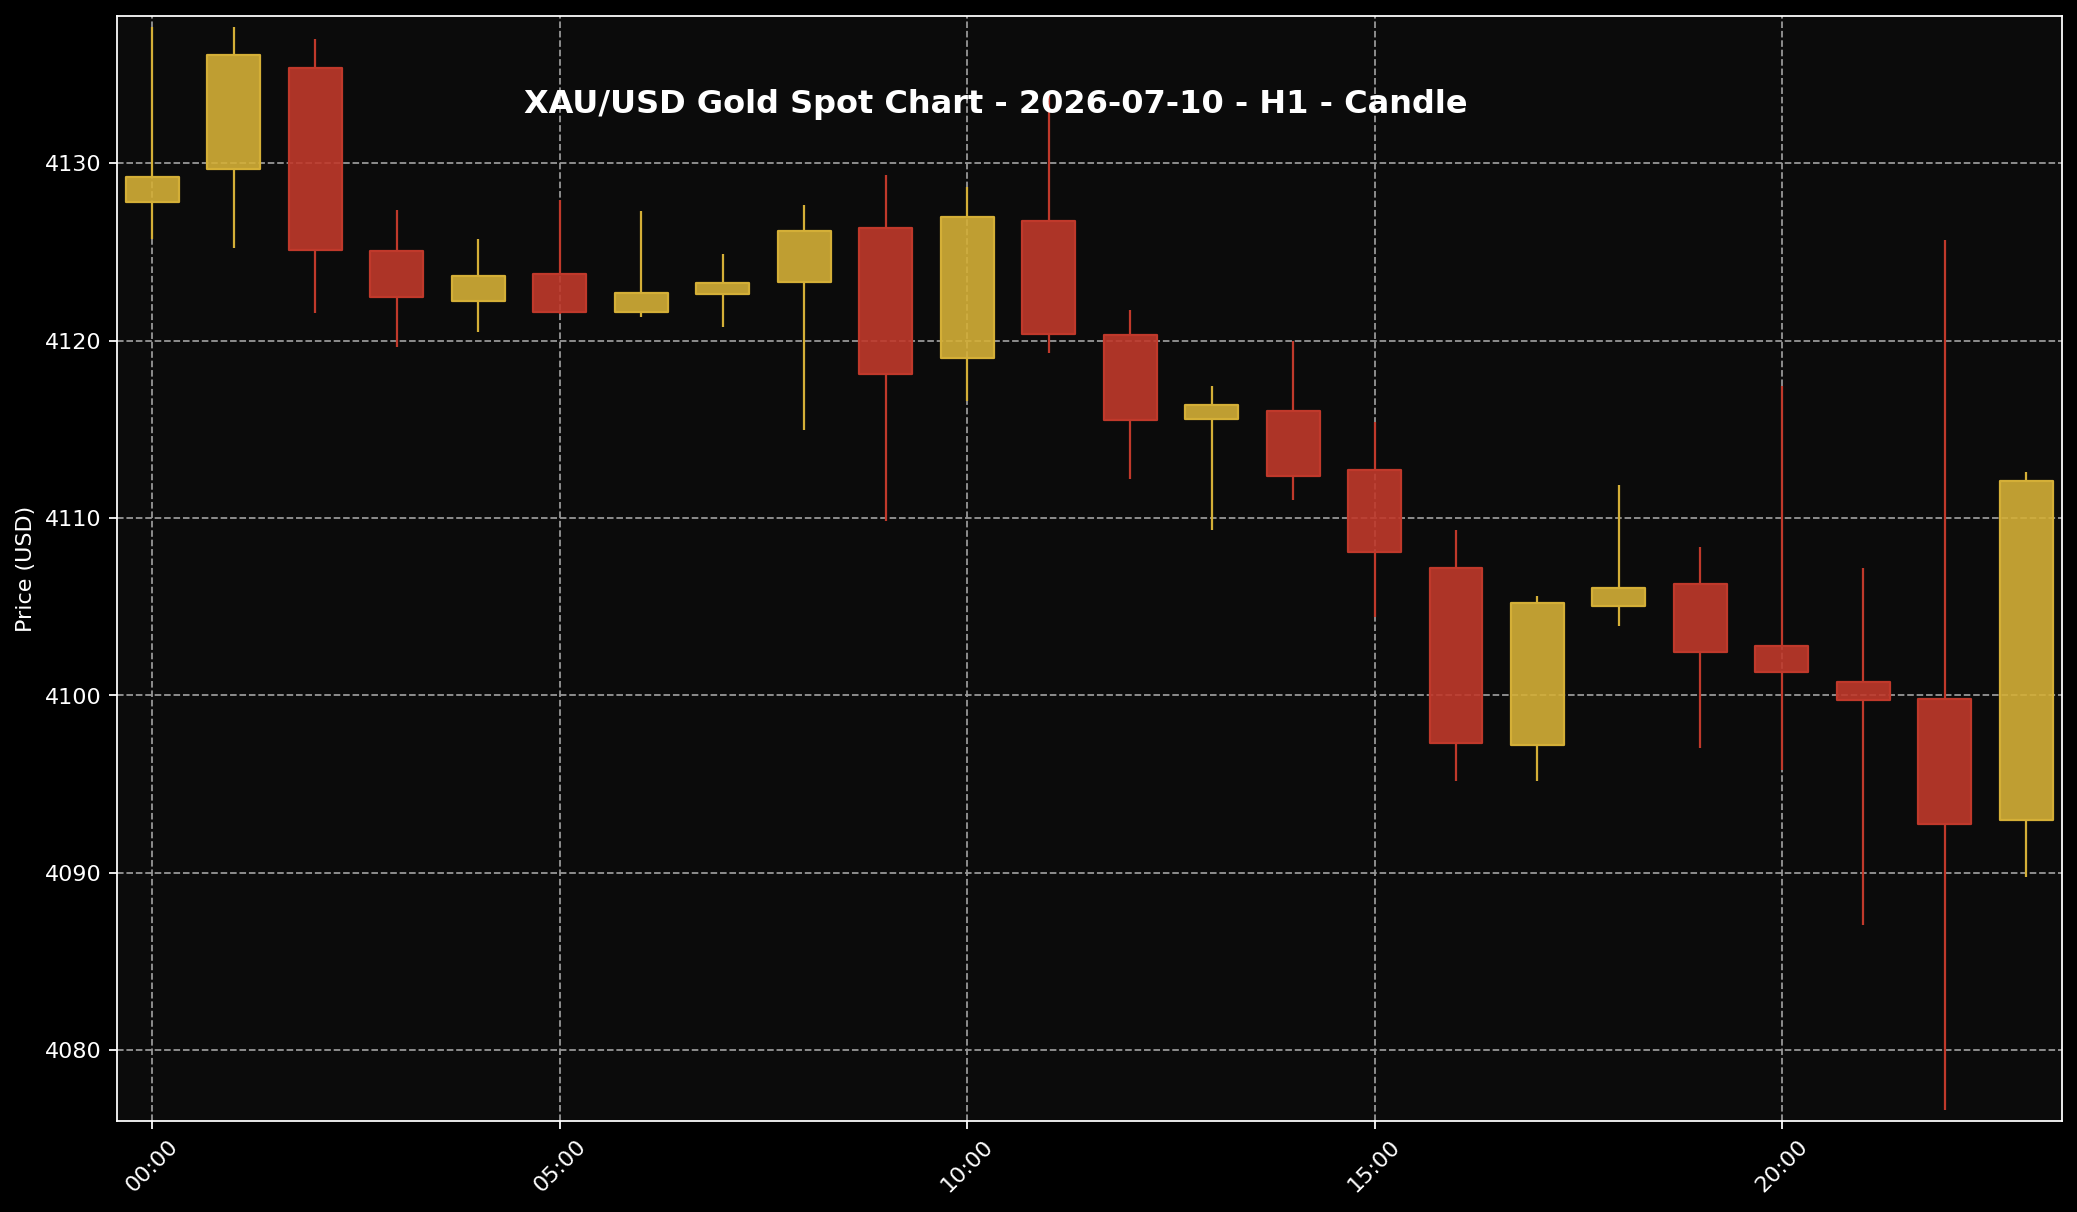 This chart helps readers see the gold price structure for the 10 July 2026 market session. It is used as market context, not as a trading signal.
1. The H1 chart for 10 July 2026 showed a fairly easy pattern to understand. Gold started from a firmer area, drifted lower through the session, dipped into the USD4,090s, and then picked itself up again late in the day. That tells us the pressure was real, but it also tells us sellers did not fully control the close.
2. When price behaves like that, it usually looks more like a market moving inside a range while trying to find direction, not a market breaking decisively into a new trend. There was an attempt to push lower, and there was also a late attempt to recover, but neither side looked strong enough to settle the bigger question properly. From a simple chart-reading point of view, the area around USD4,100 still looked important.
3. The way I would explain it at Sifu Gold is quite straightforward: gold looked pressured early, then steadied again by the end of the session. That is useful because it gives readers a market structure story without turning the chart into trading language. The chart helps us see that rate pressure was still there, but it also shows that gold had not simply rolled over into a much weaker close.
Why Did Gold Move This Way?
 The US dollar is often one of the key factors influencing gold prices. When the dollar is firmer, gold can face more noticeable pressure.
1. The main trigger came from renewed Middle East tension, including concern around energy routes such as the Strait of Hormuz. Normally, that sort of backdrop can support gold because investors start thinking about safety first. But on 10 July 2026, the market did not stop at the safe-haven angle.
2. The bigger concern was what that tension could mean for inflation. If energy supply risks start to look more serious, markets may worry that inflation becomes harder to cool. And once that thought comes back into focus, traders also start thinking that US interest rates may need to stay higher for longer. That is where Treasury yields stayed firm, and that is where gold kept running into pressure.
3. So gold was dealing with two forces at the same time. One was the usual geopolitical support that can help bullion. The other was the rate story, which tends to make gold’s job harder because gold does not pay a yield while bonds do. On this particular session, the second force looked stronger. That is why gold did not simply rally on the geopolitical headlines, even though the tension itself had not gone away.
What Does This Mean For Malaysian Gold Savers?
 For Malaysian gold savers, the key point is not only whether prices rise or fall. What matters more is budget, discipline and a clear purpose.
1. For Malaysian gold savers, the first takeaway is that geopolitical tension does not automatically mean gold must surge. If the market thinks the same tension could keep inflation sticky and rates elevated, gold can still struggle in the short term. So the real lesson here is not to read gold through one headline only. The market often reacts through several channels at the same time.
2. The second takeaway is the Ringgit translation. A global close around USD4,112.10 per ounce may sound like a US dollar story, but for local readers the converted picture matters just as much. At the approved snapshot, that global spot reference was roughly RM16,739.52 per ounce or RM538.19 per gram. That helps show why gold can still feel expensive in Malaysia even when the session itself does not look like a dramatic rally.
3. One point needs to stay clear. RM538.19 per gram is a global spot conversion into Ringgit, not the same thing as a local physical gold retail price. Local pricing can differ because of product premium, buy-sell spread, operating costs, logistics, and the structure of the Malaysian market itself. So for Sifu Gold readers, the global spot price is useful for direction, while the actual local purchase decision still needs a separate look at the real physical price on offer.
What Practical Action Makes More Sense?
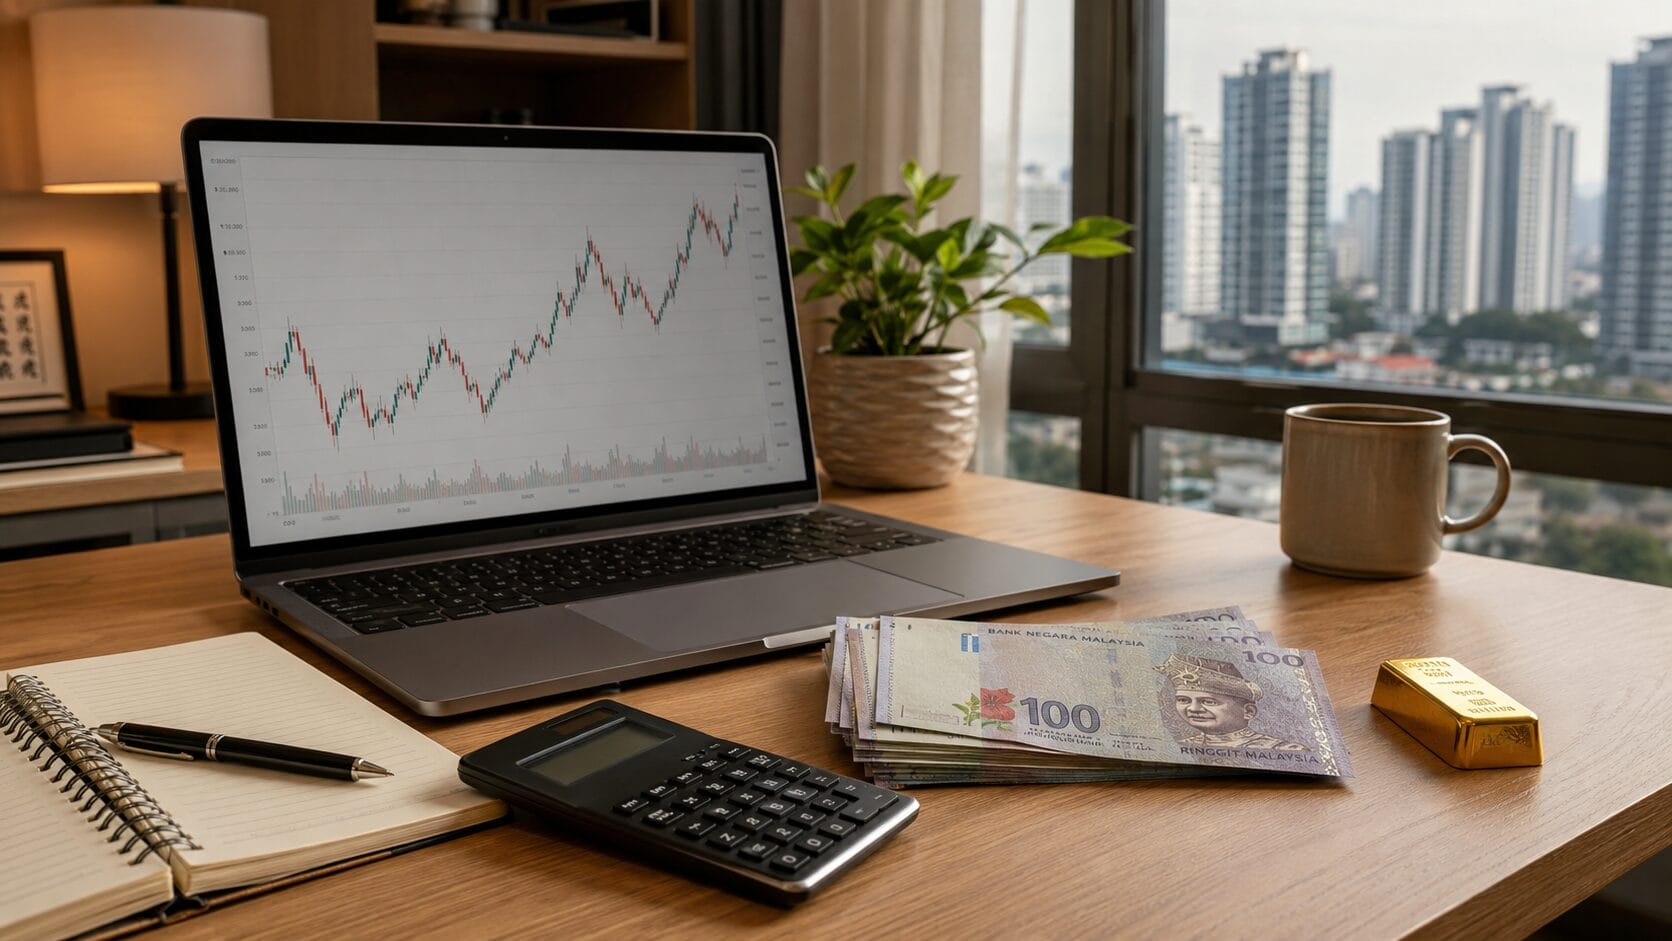 When gold prices move quickly, better decisions usually come from disciplined planning, not panic reactions.
1. If you already have a monthly budget set aside for gold saving, a session like this makes more sense as a planning checkpoint than as a reason to rush. Gold was still moving inside a cautious and mixed backdrop, so a gradual approach usually fits better than committing the full budget at once. That keeps the focus on discipline rather than reaction.
2. If you are newer to gold saving, I think the better question is not “Was this the perfect day to buy?” but “What money am I using, and does it fit my plan?” Is this extra money, or money tied to monthly commitments? Are you building grams steadily, or reacting to one day of price movement because you do not want to miss out? Those questions usually help more than trying to pick the exact lowest point of a single session.
3. And if the market still feels unclear, waiting while watching the bigger drivers is also a sensible choice. Keep an eye on Treasury yields, the Fed rate outlook, USD/MYR, and the actual local price if you plan to buy physical gold. In long-term gold saving, consistency tends to matter more than getting one day exactly right. The aim is not to win one session. The aim is to build properly over time.
Conclusion
On 10 July 2026, gold stayed under pressure not because the market had lost interest in gold altogether, but because Middle East tension also fed back into inflation worries and the US rate story. That helped keep Treasury yields firm, and it left gold struggling to move cleanly beyond the USD4,100 area even though the close looked better than the earlier part of the session. For Malaysian gold savers, I would read this as a reminder to look at the full picture: the global spot move, the Ringgit translation, the rate backdrop, and the gap between global spot pricing and local physical pricing. If your gold-saving plan is already in place, stick to the budget and build step by step. If the picture still feels mixed, it is perfectly reasonable to pause, review the numbers, and add your next grams only when the decision still makes sense for your own cash flow.

