


If we look at gold on 12 July 2026, the market still did not have a strong enough reason to push much higher. Gold held near the USD4,100 area, but the move stayed tight and hesitant. The bigger story was not just geopolitics on its own. The market was still weighing US rate expectations, Treasury yields, and how much safe-haven support gold could really hold onto. For Malaysian readers, the more useful question is what that move looked like once the same global price was translated into Ringgit.
- Introduction
- What Happened To Gold On 12 July 2026?
- What Is The Gold Chart Showing?
- Why Did Gold Move This Way?
- What Does This Mean For Malaysian Gold Savers?
- What Practical Action Makes More Sense?
- Conclusion
What Happened To Gold On 12 July 2026?
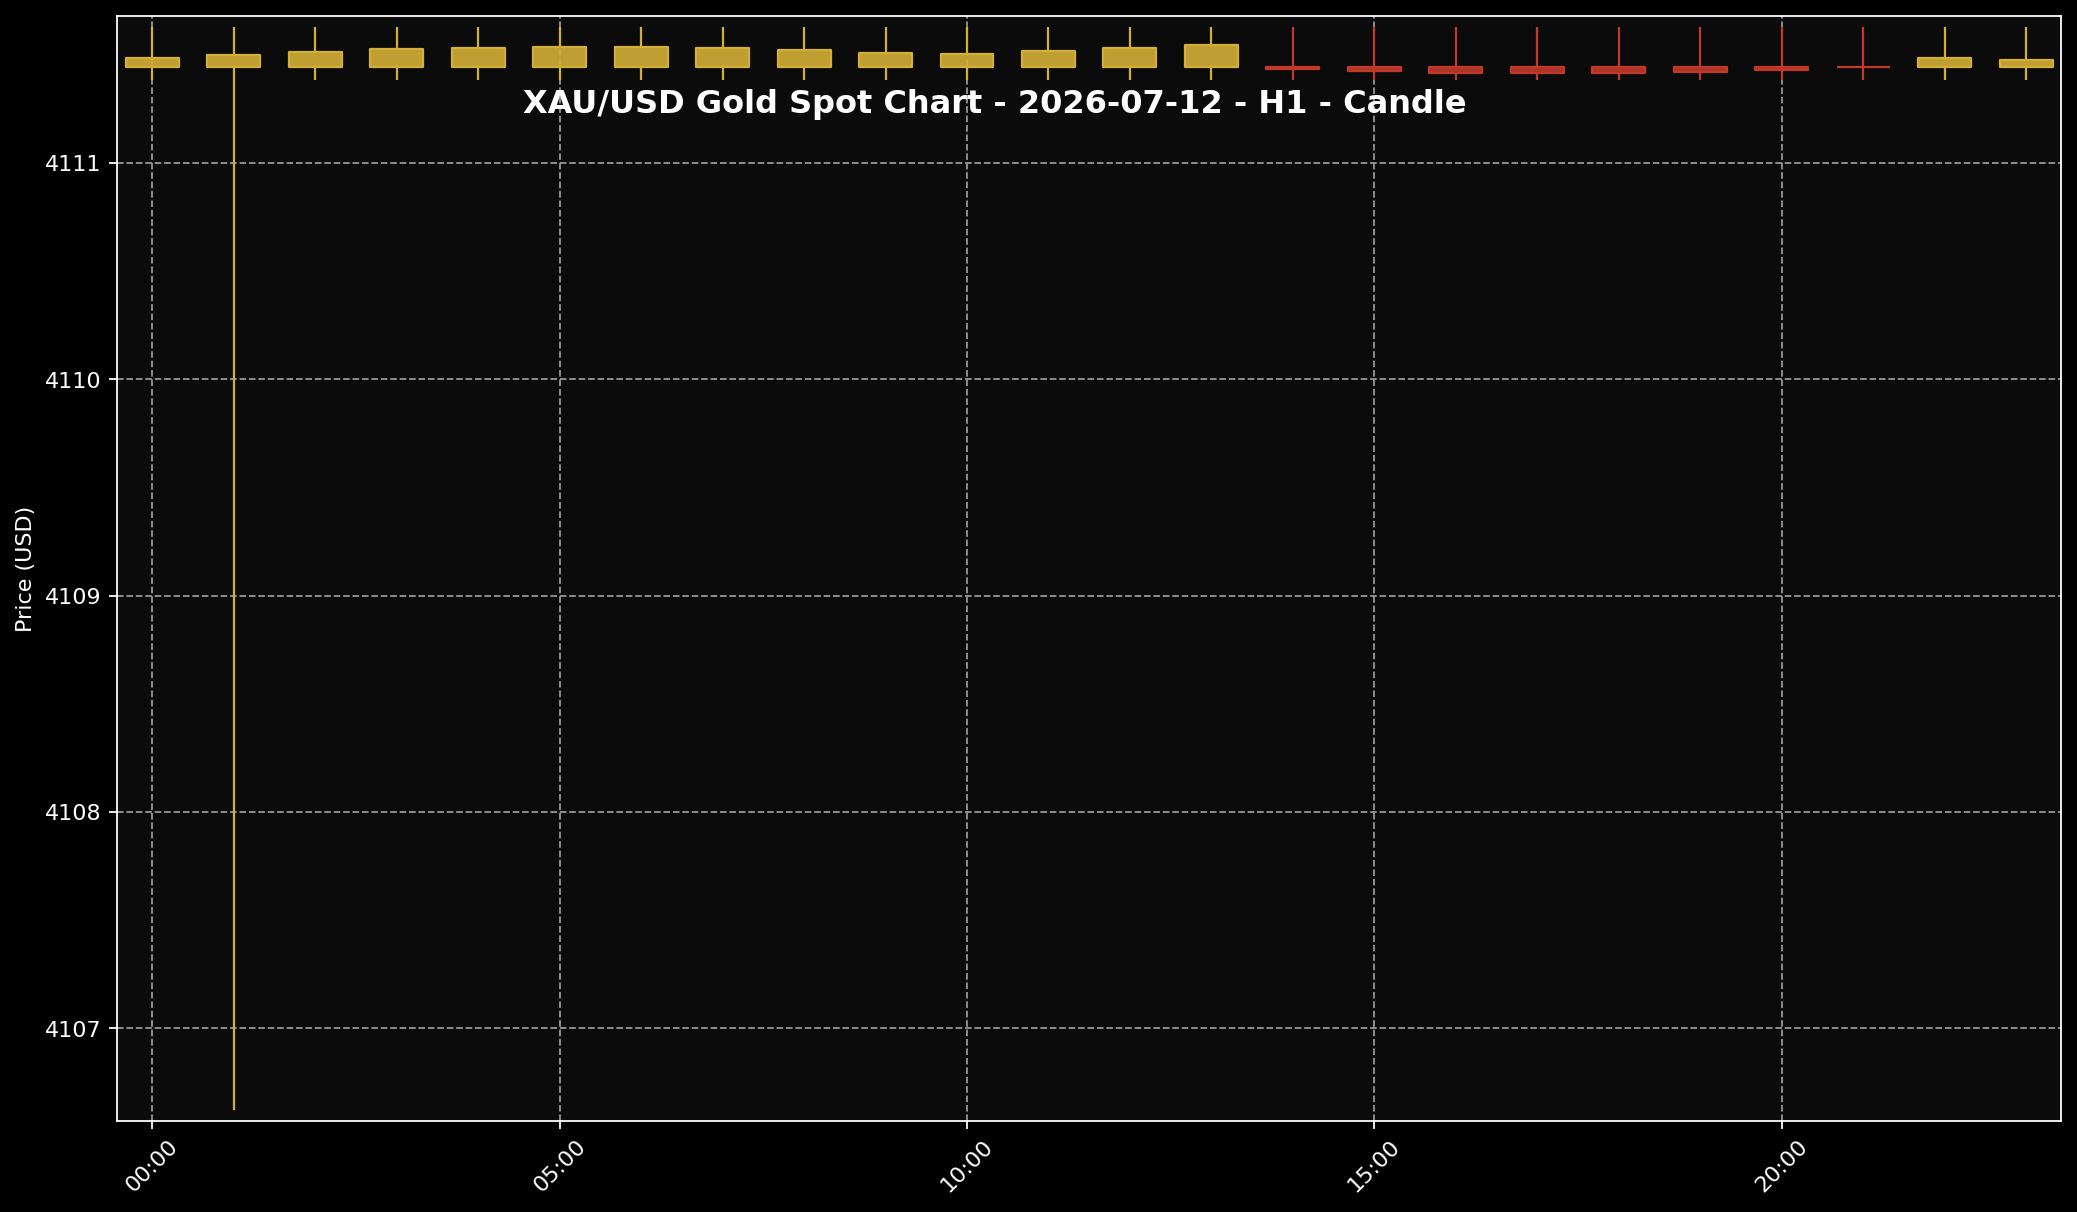 This chart shows the XAU/USD movement for the 12 July 2026 market session. Sifu Gold uses it as a visual reference, not a cue to buy emotionally.
1. Using the approved closing reference at around 11:00 PM Malaysia time, global spot gold stood near USD4,111.48 per troy ounce. Broken down into grams, that works out to about USD132.19 per gram. With USD/MYR around 4.07019 at the same reference point, the same global spot reading translated to roughly RM16,734.49 per troy ounce, or about RM538.03 per gram. These Ringgit figures are global spot conversions, not local physical retail gold prices in Malaysia.
2. In simple terms, gold did not suffer a heavy breakdown, but it also did not look strong enough to break properly higher. Price stayed close to the USD4,100 zone for most of the session. So the feel of the day was not “gold has started a fresh rally”. It was more “gold is still holding up, but the market is not fully convinced yet”.
3. That matters because many readers see a geopolitical headline and expect gold to jump straight away. This session showed that the market was reading the story in a more complicated way. Gold still had support underneath it, but the broader rate story was still stopping it from moving freely upward.
What Is The Gold Chart Showing?
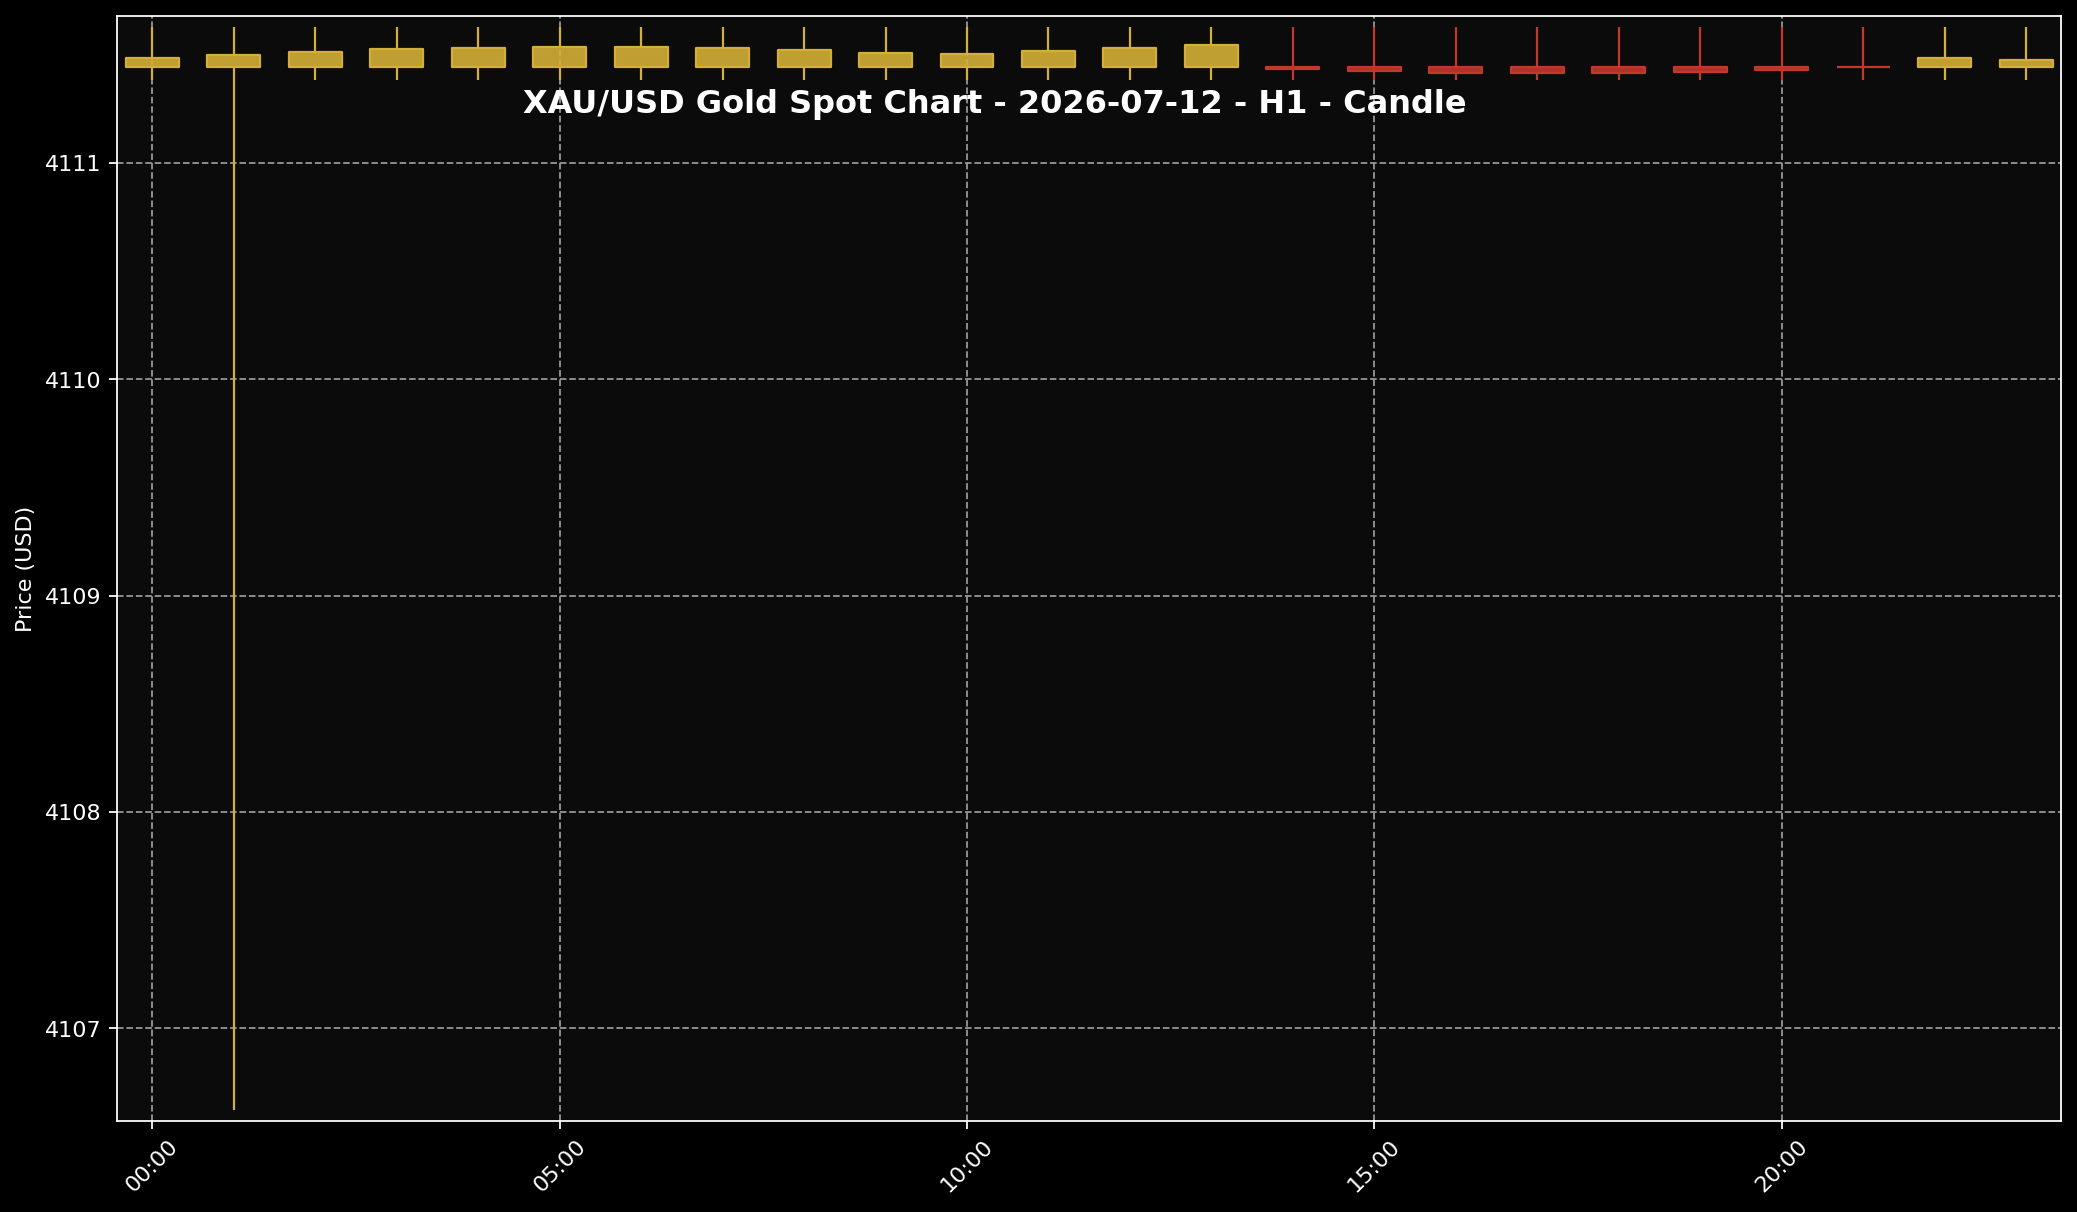 This chart helps readers see the gold price structure for the 12 July 2026 market session. It is used as market context, not as a trading signal.
1. The clearest chart message is that gold was moving in a tight range rather than making a fresh directional run. The approved H1 structure closed around USD4,111.48, with the final candle staying narrow between roughly USD4,111.38 and USD4,111.63. That usually points to a market that is pausing near an important area, not one that has already chosen a strong new direction.
2. There was also earlier intraday pressure before gold found its way back towards the same zone again. In practical terms, that tells us sellers were able to lean on the price, but not strongly enough to drive it into a much deeper late-session slide. At the same time, buyers still did not show enough strength to push the market clearly away from the USD4,100 region.
3. For everyday readers, this does not need to be read like trader language. The simpler reading is enough: gold was still hovering near a watched level, and the market was still waiting for a stronger reason to move. That is why the chart fits a “still constrained” story better than a “new breakout” story.
Why Did Gold Move This Way?
 The US dollar is often one of the key factors influencing gold prices. When the dollar is firmer, gold can face more noticeable pressure.
1. The main explanation comes from the way the market read Middle East tension. Normally, geopolitical stress can help gold because investors often see it as a safe-haven asset. But this time, that same tension also raised concern that inflation pressure could stay around for longer. Once that idea enters the market, traders start thinking US interest rates may not come down as easily or as soon as hoped.
2. That is where gold starts to feel resistance. When rate expectations stay high, Treasury yields often stay firm as well. A Treasury yield is simply the return investors can get from holding US government bonds. If those returns still look attractive, some money will keep leaning towards bonds instead of gold. So the chain looked like this: geopolitical tension stayed elevated, the market linked that tension to inflation and policy risk, rate expectations stayed firm, yields remained supportive, and gold found it harder to build proper upside momentum.
3. The body-backed Reuters route and the recovered Kitco layer point in the same general direction. Gold was not losing relevance, but the usual safe-haven boost was being limited by a market that still had higher-for-longer rate thinking in the background. That is why the session looked more like controlled pressure than panic selling.
What Does This Mean For Malaysian Gold Savers?
 For Malaysian gold savers, the key point is not only whether prices rise or fall. What matters more is budget, discipline and a clear purpose.
1. For Malaysian gold savers, the first thing to notice is that a gold price which looks stuck in US dollar terms can still feel expensive once it is translated into Ringgit. At the approved snapshot, global spot gold was still near RM538.03 per gram. So even if international headlines describe gold as under pressure, the local feeling may still be that the price is not especially low.
2. This is why looking at XAU/USD alone is never enough. Two moving parts matter at the same time: the global gold price and the USD/MYR exchange rate. If gold softens a little in USD but the US dollar stays firm against the Ringgit, the local impact may not feel like much of a discount. That helps explain why foreign headlines and Malaysian price impressions can sometimes feel out of sync.
3. One more point matters here. The RM538.03 per gram figure is only a direct Ringgit translation of global spot gold. It is not the same as a local physical retail price. Physical gold in Malaysia can still sit higher because of product structure, operational cost, logistics, and the usual buy-sell spread. So the better habit is to use the global spot conversion as a guide, then compare it carefully with the local product price you are actually considering.
What Practical Action Makes More Sense?
 When gold prices move quickly, better decisions usually come from disciplined planning, not panic reactions.
1. In my view, a session like this is better used to organise your next step, not to react emotionally to a single market move. If you already have a monthly budget set aside for gold, a gradual buying approach can still make sense. The aim is not to guess the exact lowest price. The aim is to build grams steadily in a way that matches your own plan.
2. If you still feel unsure, waiting is also a valid disciplined choice. Gold is still holding near the USD4,100 area, but the market has not yet shown a fully clear new direction. It makes sense to keep an eye on the bigger drivers first, especially US rate expectations, Treasury yields, and USD/MYR, because those can shape how any global move ends up feeling in Malaysia.
3. More importantly, do not go in heavily all at once and do not commit the full budget at once just because gold looks slightly softer on one day. Household commitments, emergency savings, and monthly cash flow still come first. Gold makes more sense when it is treated as a long-term saving tool, not as a short-term emotional reaction to headlines.
Conclusion
On 12 July 2026, gold stayed close to the USD4,100 area, but it still did not have enough fresh strength to break properly higher. The main reason was not that gold had lost its role. It was that the market was still giving a lot of weight to firm rate expectations and firm yields, even while geopolitical tension remained in the background. For Malaysian gold savers, that makes the Ringgit translation especially important. In US dollar terms, gold looked stuck. In Ringgit terms, it could still feel relatively elevated. So the more sensible approach here is to check your budget, understand the difference between global spot and local physical pricing, and continue only with a gradual plan that fits your own financial capacity.

