


What happened to gold on 2 August 2026? As the new trading week reopened, gold was still moving with the same pressure left from the previous full session. Softer US PCE inflation data had given gold some support earlier, but that was not enough to change the whole story. The US dollar regained strength, US Treasury yields stayed elevated, and gold still did not have a clear path to move much higher.
- Introduction
- What Happened To Gold On 2 August 2026?
- What Is The Gold Chart Showing?
- Why Did Gold Move This Way?
- What Does This Mean For Malaysian Gold Savers?
- What Practical Action Makes More Sense?
- Conclusion
What Happened To Gold On 2 August 2026?
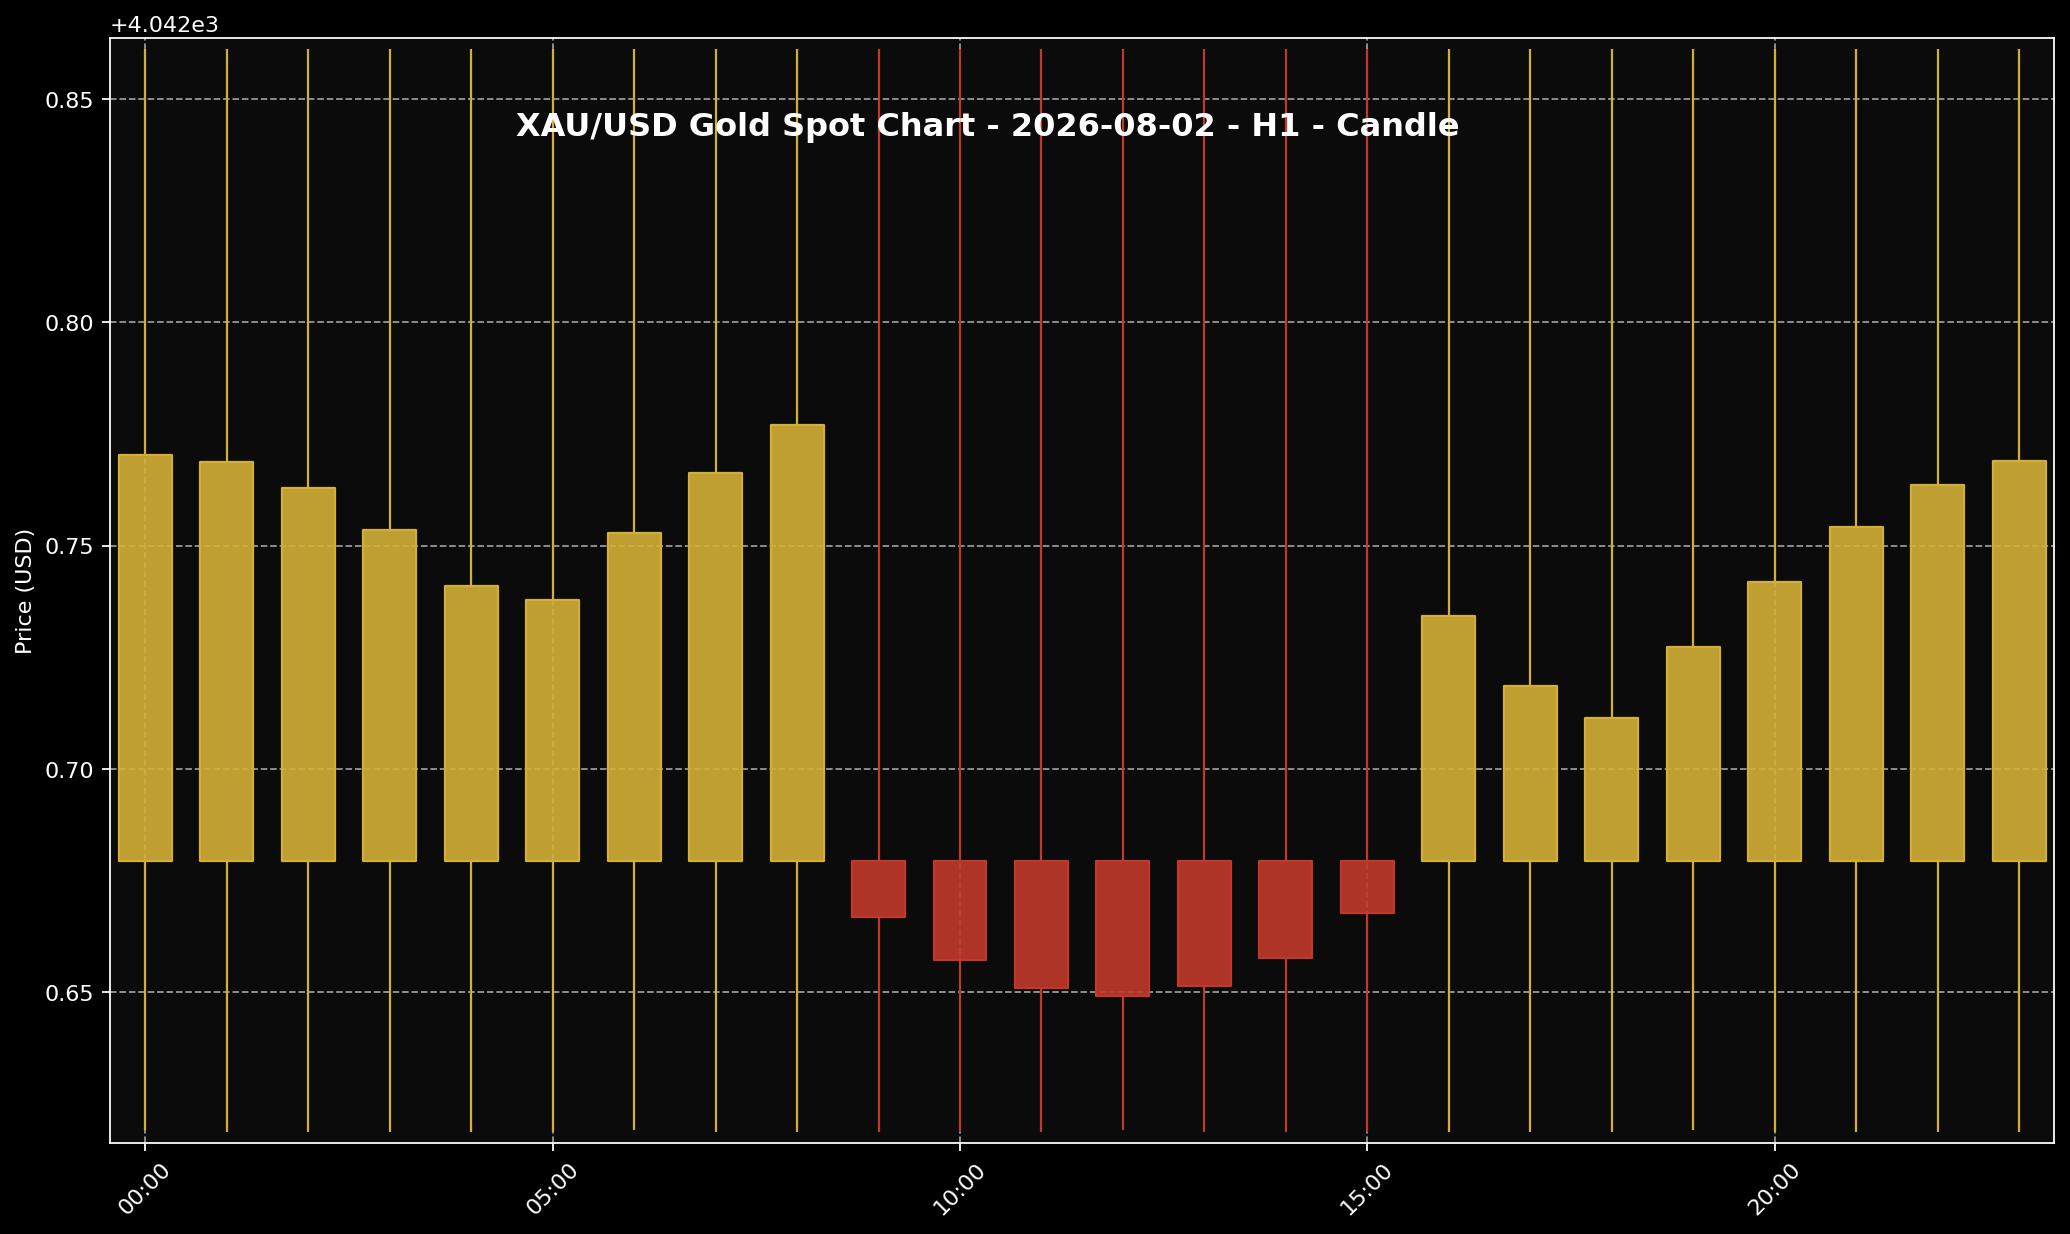 This chart shows the XAU/USD movement for the 2 August 2026 market session. Sifu Gold uses it as a visual reference, not a cue to buy emotionally.
1. Around 11:00 PM Malaysia time, the global spot gold reference was around USD4,042.77 per troy ounce. Converted into grams, that was roughly USD129.98 per gram. Based on USD/MYR around 4.08525, the same global spot reference was about RM16,515.72 per troy ounce, or around RM530.99 per gram.
2. These Ringgit numbers are only global spot conversions. They are not the same as the physical gold retail price people see in Malaysia. Local physical gold pricing can include USD/MYR movement, premiums, buy-sell spread, product cost, logistics and the local pricing structure.
3. The main story was not that gold suddenly collapsed. It was more that gold still could not build a clearer push higher. Softer US PCE inflation data had helped gold earlier, but the stronger US dollar and higher bond yields kept the metal stuck around the low USD4,000 area.
What Is The Gold Chart Showing?
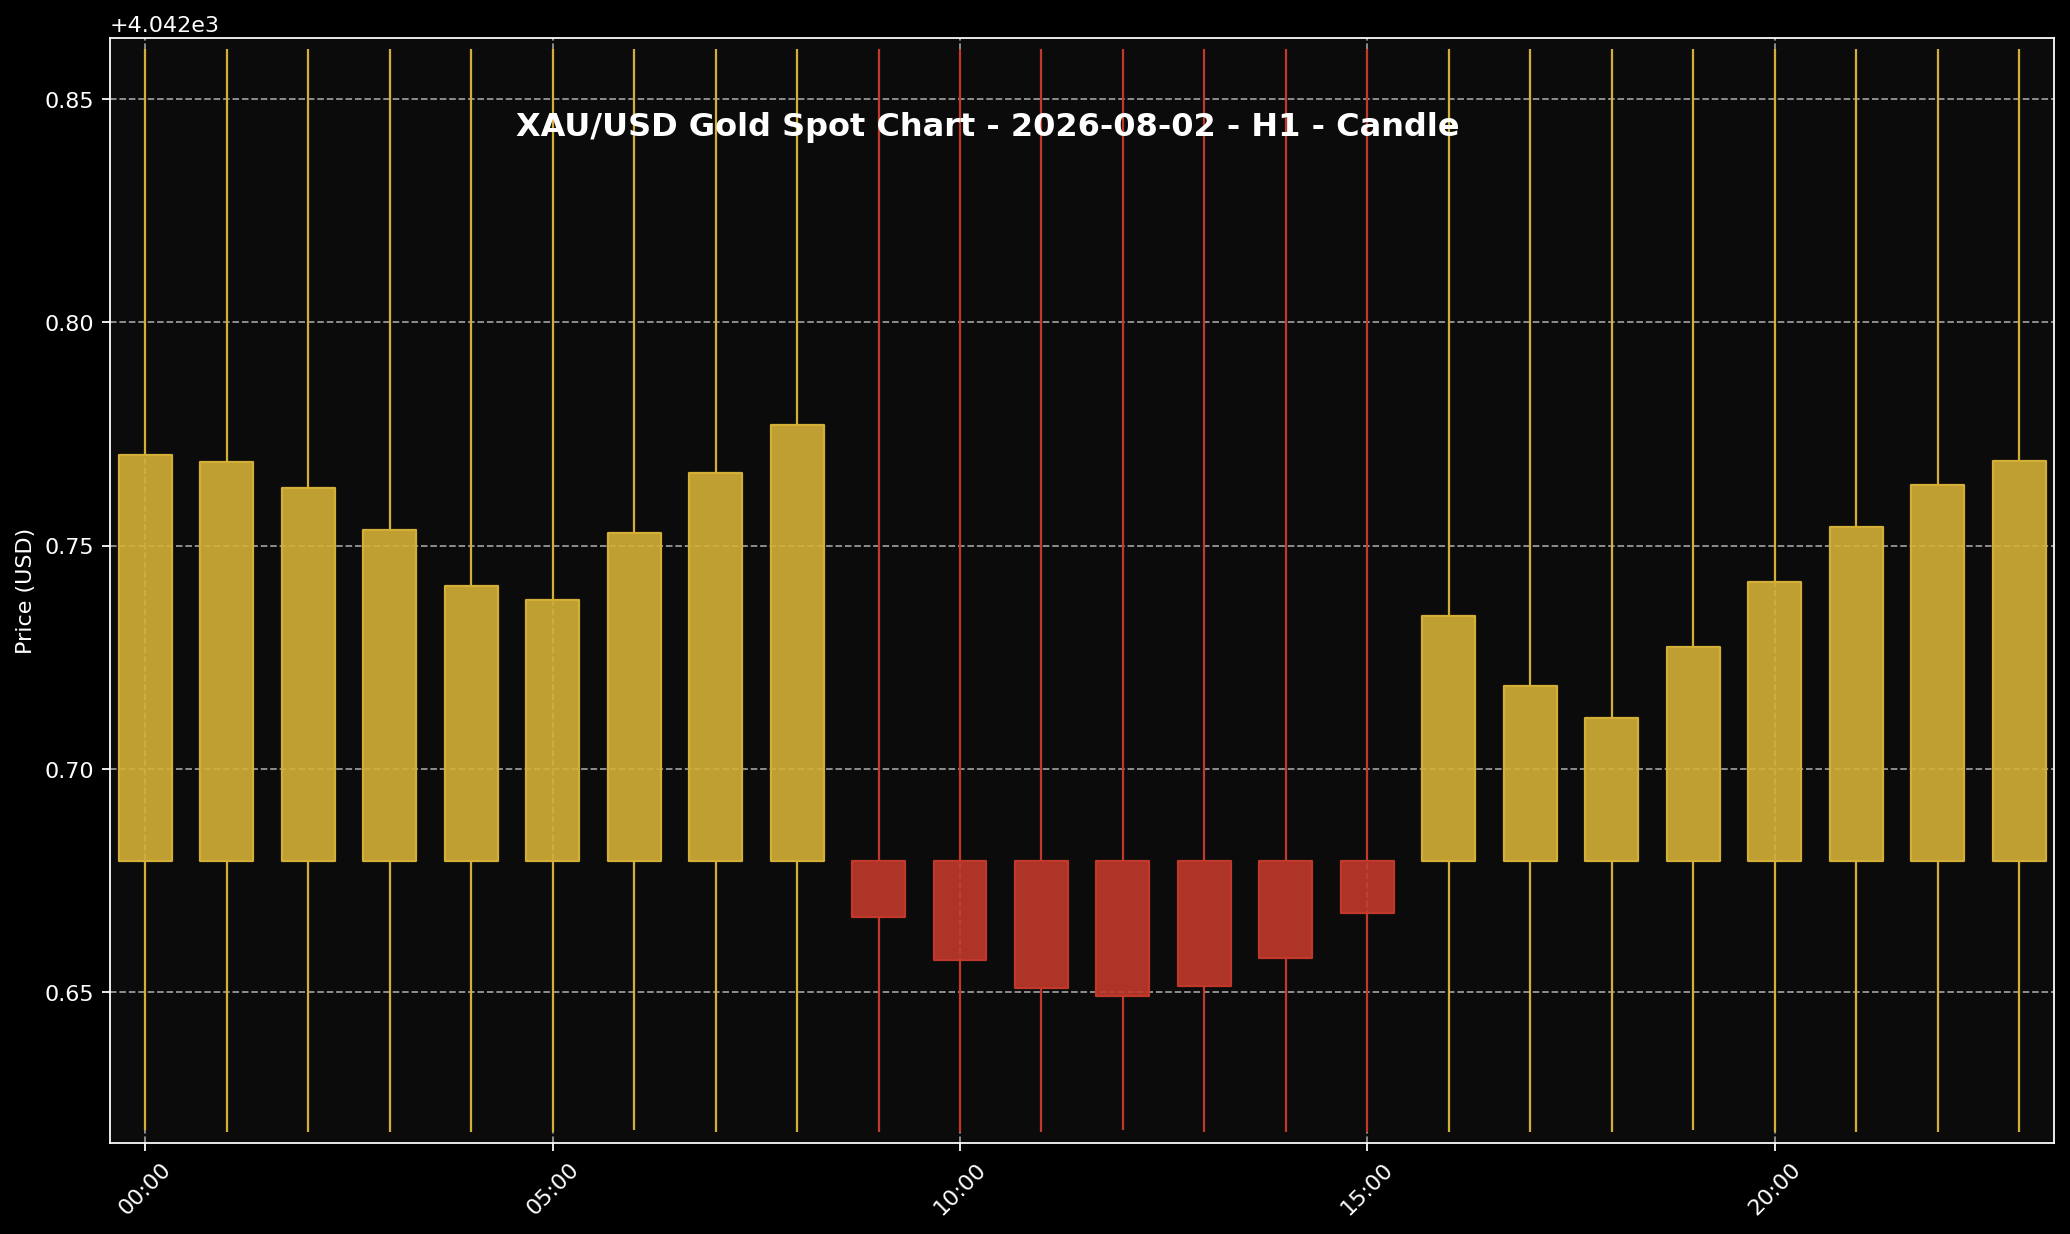 This chart helps readers see the gold price structure for the 2 August 2026 market session. It is used as market context and price-structure reference only.
1. The H1 gold chart showed a fairly tight trading range. Gold had a softer patch around the middle of the session, then tried to recover later in the day. But that recovery still looked more like a small rebound inside the same range, not a strong new direction.
2. Put simply, the chart did not show a clean breakout. Gold was still trying to hold around the low USD4,000 area, but it did not yet look strong enough to run much further. For me, this is better read as a market still searching for direction, not as a signal.
3. For gold savers, this kind of chart is useful as background. It helps us see that buyers were still trying to support the price, but the pressure from the US dollar and Treasury yields had not gone away. So the chart gives context, not a buying or selling instruction.
Why Did Gold Move This Way?
 The US dollar is often one of the key factors influencing gold prices. When the dollar is firmer, gold can face more noticeable pressure.
1. The clearest daily pressure came from two things: the US dollar and US Treasury yields. Kitco’s market coverage pointed to gold being weighed down after the dollar strengthened, yields stayed elevated, and support from softer PCE inflation data was not strong enough to carry gold much higher.
2. Reuters-linked market coverage through a validated publisher route carried a similar message: gold slipped as the US dollar regained footing. This matters because gold is usually priced in US dollars. When the dollar gets stronger, buyers outside the United States often have to pay more in their own currency for the same gold.
3. Treasury yields matter in a different way. When US bond yields are still attractive, some investors compare gold with assets that pay interest. Gold does not pay interest. So when yields remain high, gold can find it harder to climb quickly, even when an inflation data point gives it some support.
What Does This Mean For Malaysian Gold Savers?
 For Malaysian gold savers, the key point is not only whether prices rise or fall. What matters more is budget, discipline and a clear purpose.
1. For Malaysian gold savers, the useful point is not to look at the USD gold price alone. Global gold moves in US dollars, but most Malaysian buyers think in Ringgit. That is why USD/MYR becomes an important part of the local picture.
2. In this 2 August 2026 reference, global spot gold around USD4,042.77 per troy ounce translated to about RM530.99 per gram. That gives a helpful base view of global gold value in Ringgit. But it still does not mean the local physical gold price will match that number exactly.
3. If you are buying physical gold, the final price can include product premium, buy-sell spread, operating cost, logistics and local pricing structure. So even when global spot gold looks stuck or slightly lower, the Malaysian physical price may not move at the same pace. The way I see it at Sifu Gold, gold savers should look at the bigger picture, not just one number on the chart.
What Practical Action Makes More Sense?
 When gold prices move quickly, better decisions usually come from disciplined planning, not panic reactions.
1. If you already have a monthly budget for gold saving, this kind of market is a good time to review the plan. Not to chase price. Not to go in heavily all at once. A more practical approach is to split the budget and buy in stages, if it already fits your own cash flow.
2. If this month’s budget is tight, there is no need to force it. Gold is a long-term saving habit, not a one-day race. Family commitments, emergency savings and daily cash flow still come first. For me, gold saving only works well when it goes together with good money discipline.
3. If the market still feels unclear, waiting for a more stable price picture is also a sensible decision. Watch four things: the US dollar, US Treasury yields, USD/MYR and local physical gold pricing. The goal is not to guess the lowest price perfectly. The goal is to build grams in a way that fits your own budget.
Conclusion
For 2 August 2026, gold still did not have a clear new direction. Softer US PCE inflation data gave some support, but the stronger US dollar and elevated US Treasury yields remained the bigger pressure in the short-term story. That is why gold stayed around the low USD4,000 area instead of moving clearly higher. For Malaysian gold savers, my view is simple. Check your budget, understand the difference between global spot gold and local physical gold pricing, and avoid decisions driven by emotion. If you are building gold savings bit by bit, the Gold Accumulation Program by Public Gold lets you start saving gold from as low as RM100, based on your own ability and plan.

