


What happened to gold on 3 August 2026? It was not a strong rally, and it was not a sharp breakdown either. Gold stayed around the big USD4,000 area while the market weighed a few things at the same time. A softer US dollar gave gold some support. But inflation worries, stronger US data, and a still-cautious Federal Reserve story kept the move from going too far. For Malaysian gold savers, this was a day to read with budget and discipline, not just one candle on a chart.
- Introduction
- What Happened To Gold On 3 August 2026?
- What Is The Gold Chart Showing?
- Why Did Gold Move This Way?
- What Does This Mean For Malaysian Gold Savers?
- What Practical Action Makes More Sense?
- Conclusion
What Happened To Gold On 3 August 2026?
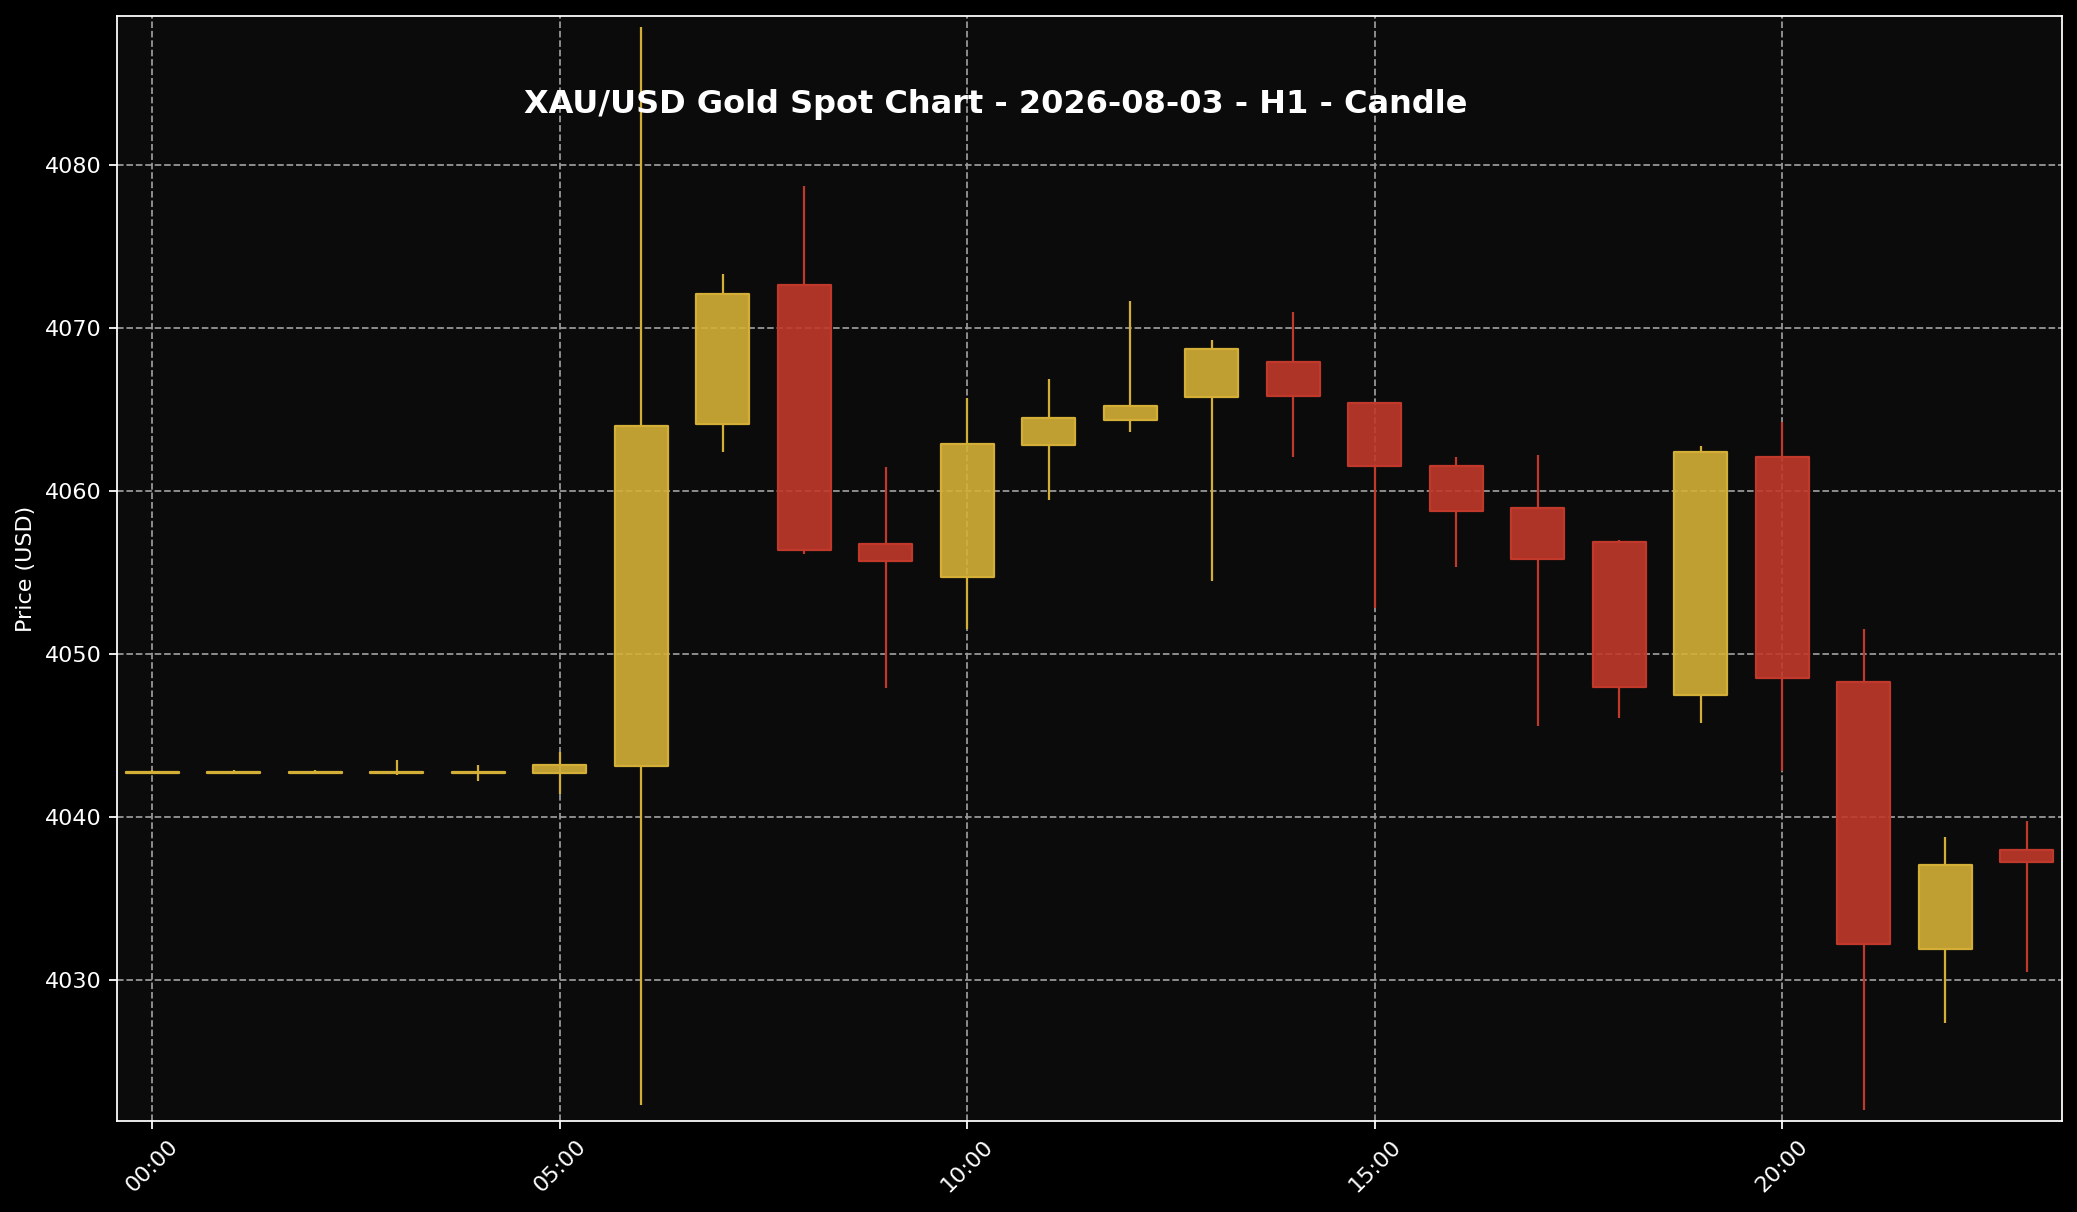 This chart shows the XAU/USD movement for the 3 August 2026 market session. Sifu Gold uses it as a visual reference, not a cue to buy emotionally.
1. On 3 August 2026, global gold was still moving close to the USD4,000 zone. The approved snapshot around 11:00 PM Malaysia time showed XAU/USD at about USD4,037.22 per troy ounce. Converted into grams, that works out at roughly USD129.80 per gram. Using the USD/MYR rate of about 4.09619 at the same snapshot time, that global spot price was around RM16,537.24 per troy ounce, or about RM531.68 per gram.
2. That Ringgit translation matters because most Malaysian savers do not think in US dollars. But the key point is this: the RM531.68 per gram figure is a global spot conversion into Ringgit. It is not the local physical retail price in Malaysia, and it is not the price of any specific gold product. Physical gold prices can differ because of product premiums, buy-sell spread, local pricing structure, operational costs, and USD/MYR movement.
3. If we look at the story behind the move, gold received some help from a softer US dollar and hopes that Middle East tension could ease slightly. When the US dollar weakens, gold can become easier to buy for holders of other currencies. But that support was not strong enough to push gold clearly away from the USD4,000 area, because the market was still watching inflation, US data, and the Fed rate story.
What Is The Gold Chart Showing?
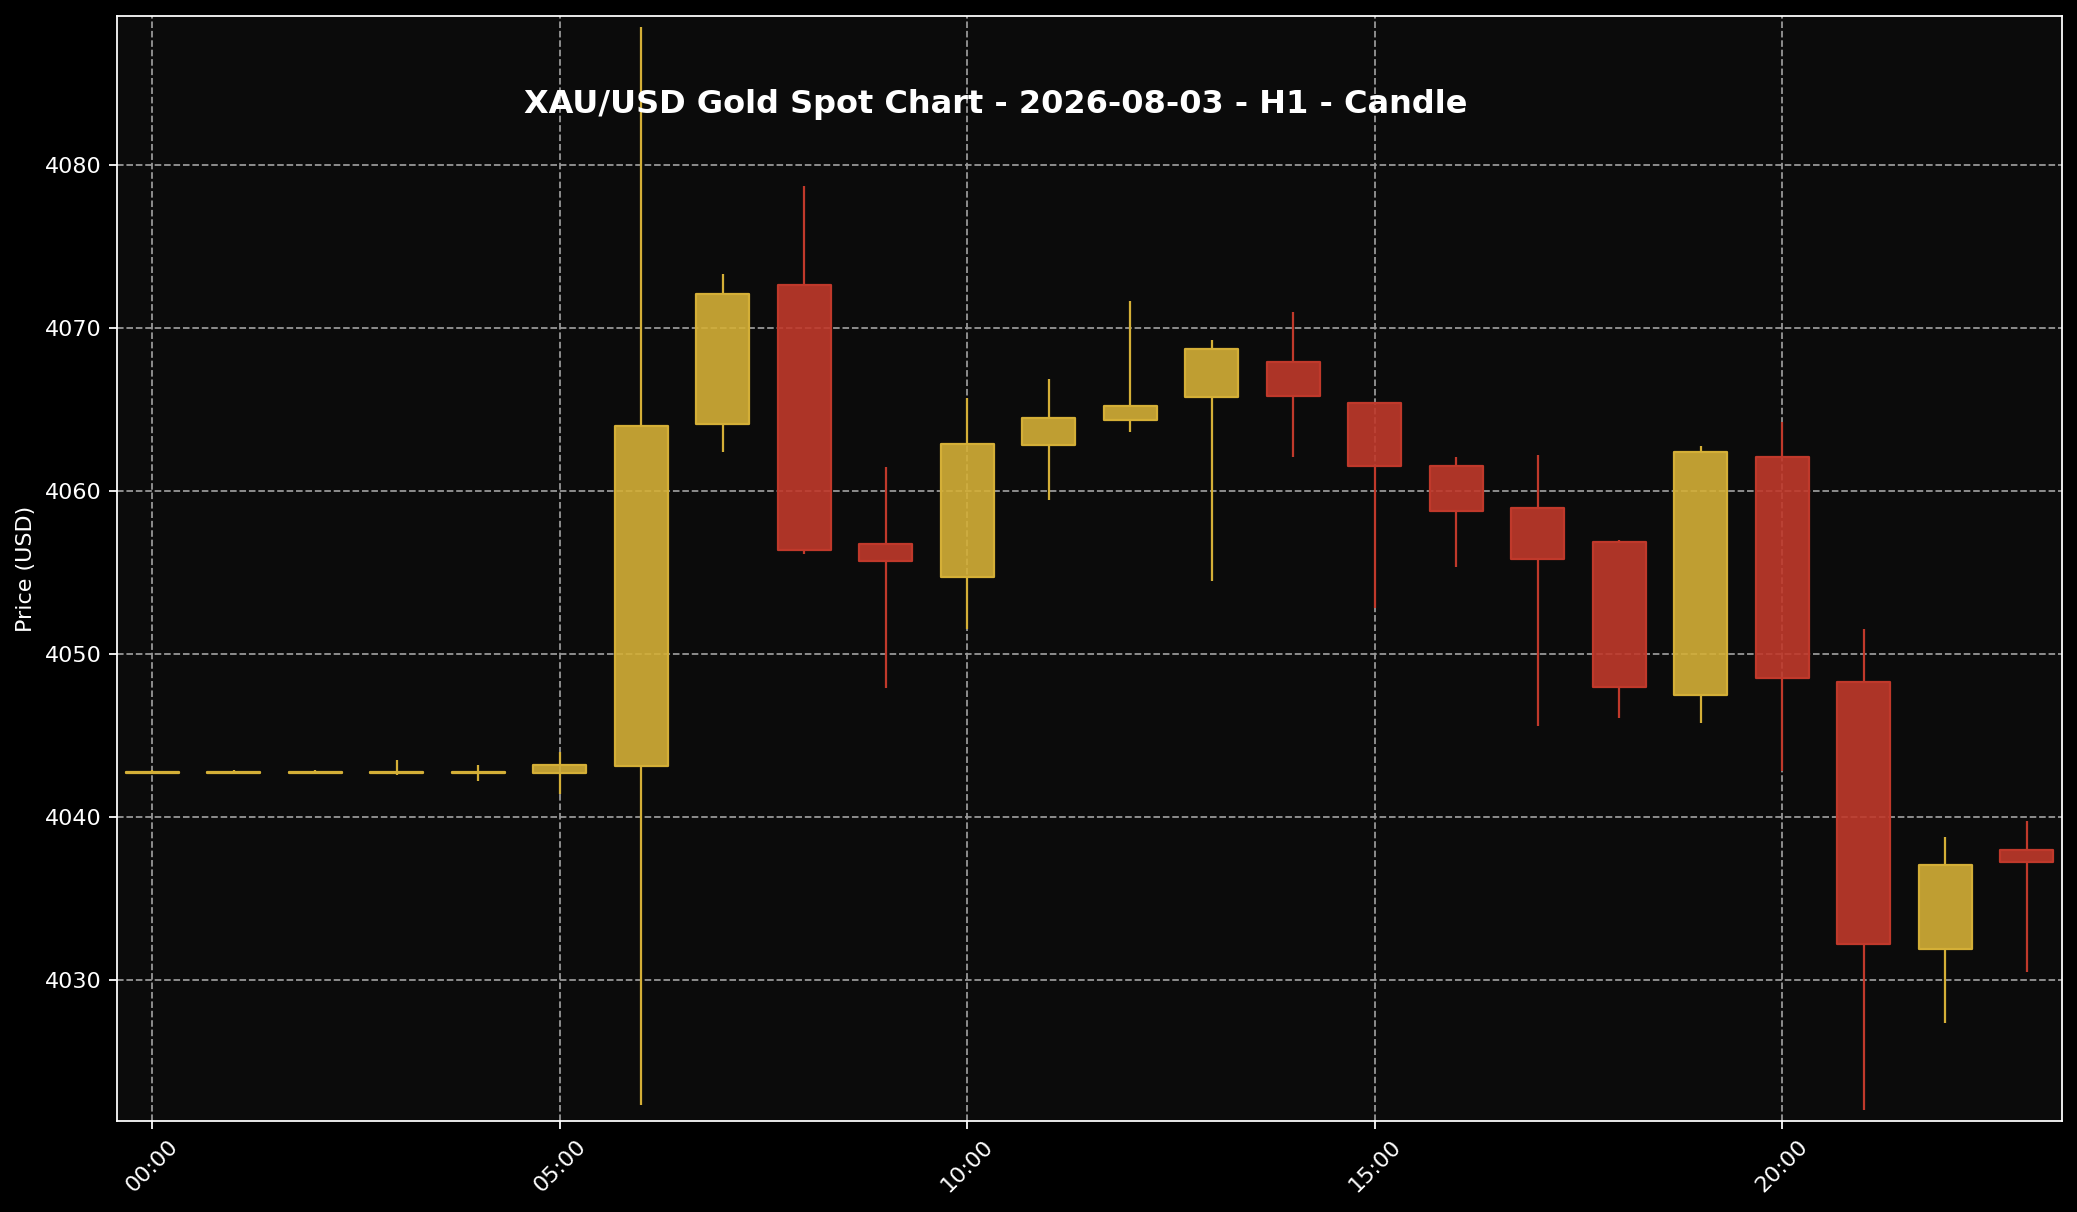 This chart helps readers see the gold price structure for the 3 August 2026 market session. It is used as market context and price-structure reference only.
1. The H1 chart for 3 August 2026 showed gold starting with smaller movement first, before pushing higher towards the area around USD4,070. After that, the price did not continue climbing cleanly. A few candles showed the market trying to hold near the upper area, but selling pressure also came back in. Put simply, buyers did try to lift the price, but not strongly enough to turn the day into a clean upward move.
2. Towards the later part of the session, gold moved back down towards the USD4,030 to USD4,040 area. That fits the bigger message of the day: gold still had support, but it also had pressure. A chart like this is better read as a market still trying to find direction, rather than a market that has already given a clear answer.
3. For gold savers, I would not read this chart as a signal. I prefer to use the chart as a simple structure tool. On that day, the structure was quite clear: gold tried to rise, failed to stay near the higher area, then moved back down near the end of the session. If someone only looks at one price point, they may miss the fuller story of the day.
Why Did Gold Move This Way?
 The US dollar is often one of the key factors influencing gold prices. When the dollar is firmer, gold can face more noticeable pressure.
1. The main reason came from mixed market drivers. Reuters-backed market coverage showed gold getting support when the US dollar declined, while hopes around the Middle East situation also affected oil prices. When oil prices fall, the market may feel that short-term inflation pressure is not as aggressive as feared. In that kind of environment, gold can get some breathing room.
2. But the story did not end there. Kitco’s gold coverage also pointed to gold struggling to move far away from the USD4,000 area. One reason was stronger-than-expected US ISM Manufacturing PMI data. When US economic data looks stronger, the market can think the Federal Reserve still has room to stay firm on interest rates while it watches inflation.
3. So gold was caught between two sides. On one side, a softer US dollar and geopolitical headlines gave support. On the other side, inflation risk, stronger US data, real yields, and the Fed backdrop limited the upside. That is why gold’s move on 3 August 2026 looked mixed. It was not a story of gold becoming fully strong again, but it was also not a story of gold losing all support.
What Does This Mean For Malaysian Gold Savers?
 For Malaysian gold savers, the key point is not only whether prices rise or fall. What matters more is budget, discipline and a clear purpose.
1. For Malaysian gold savers, the important point is not only that gold was around USD4,037 per troy ounce. The more useful question is what that global price looks like once it is translated into Ringgit. At a USD/MYR rate of about 4.09619, the global spot reference of around USD4,037.22 became roughly RM531.68 per gram. That gives Malaysian readers a clearer base figure, even though local physical gold prices can move differently.
2. When global gold is quoted in US dollars, two things matter for Malaysian readers at the same time: the gold price itself and USD/MYR. If global gold rises but the Ringgit strengthens, the local effect may not feel exactly the same. If global gold moves slowly but USD/MYR changes, local pricing can still feel different. That is why physical gold savers should not read XAU/USD alone without also looking at the Ringgit side.
3. The way I see it at Sifu Gold, a day like this is a good reminder to read the market with more structure. Physical gold is not the same as a trading chart. It has spread, premium, and its own local pricing structure. If someone is saving gold for the long term, the main focus is not to guess the lowest price every day. The focus is to build grams according to ability, understand the cost of buying and selling, and make sure the purchase does not disturb monthly commitments.
What Practical Action Makes More Sense?
 When gold prices move quickly, better decisions usually come from disciplined planning, not panic reactions.
1. If you already have a monthly budget set aside for gold, a gradual approach still makes more sense than trying to catch the perfect price. A mixed day like this can be used to review the plan. How much budget feels comfortable? How many grams are you trying to build slowly? Is the purchase coming from money already set aside for savings, or from the feeling that you might miss out?
2. If this month’s budget is tight, there is no need to force it. Gold can be useful as a long-term saving asset, but home commitments, family needs, debt payments, emergency funds, and cash flow still matter. Do not go in heavily all at once just because gold looks lower or is still near an important zone. Good gold saving is not only about being willing to buy. It is also about knowing when to keep the purchase smaller.
3. If you are still unsure, waiting for a clearer market reading can also be a disciplined decision. Watch a few simple things: the US dollar, the Fed story, inflation, US bond yields, and USD/MYR. If these factors stay mixed, gold may continue moving up and down within a range. For gold savers, better decisions usually come from a clear plan, not from reacting quickly to one headline.
Conclusion
My takeaway for 3 August 2026 is this: gold was still looking for direction around the USD4,000 area. A softer US dollar and hopes of easing Middle East tension gave some support, but inflation, stronger US data, and the still-firm Fed backdrop kept gold from building a cleaner move higher. For Malaysian gold savers, I would not treat one mixed session as the full answer for where gold is going next. I would read it as a reminder to check the budget, understand the difference between global spot gold and local physical pricing, and keep building grams according to ability. If you want to start small, the Gold Accumulation Program by Public Gold allows gold saving from as low as RM100, which can be a practical way to build grams little by little without disturbing your main commitments.

