


What happened to gold on 17 August 2026? Gold found support as the US dollar weakened and the market became less worried about another Fed rate hike. But the story was not one-way. Treasury yields still rose after oil prices jumped, and that kept some pressure on gold. For Malaysian gold savers, the useful part is not just whether gold moved higher. It is how that global move looks once we read it through Ringgit, spot price and local physical gold pricing.
- Introduction
- What Happened To Gold On 17 August 2026?
- What Is The Gold Chart Showing?
- Why Did Gold Move This Way?
- What Does This Mean For Gold Savers?
- Conclusion
What Happened To Gold On 17 August 2026?
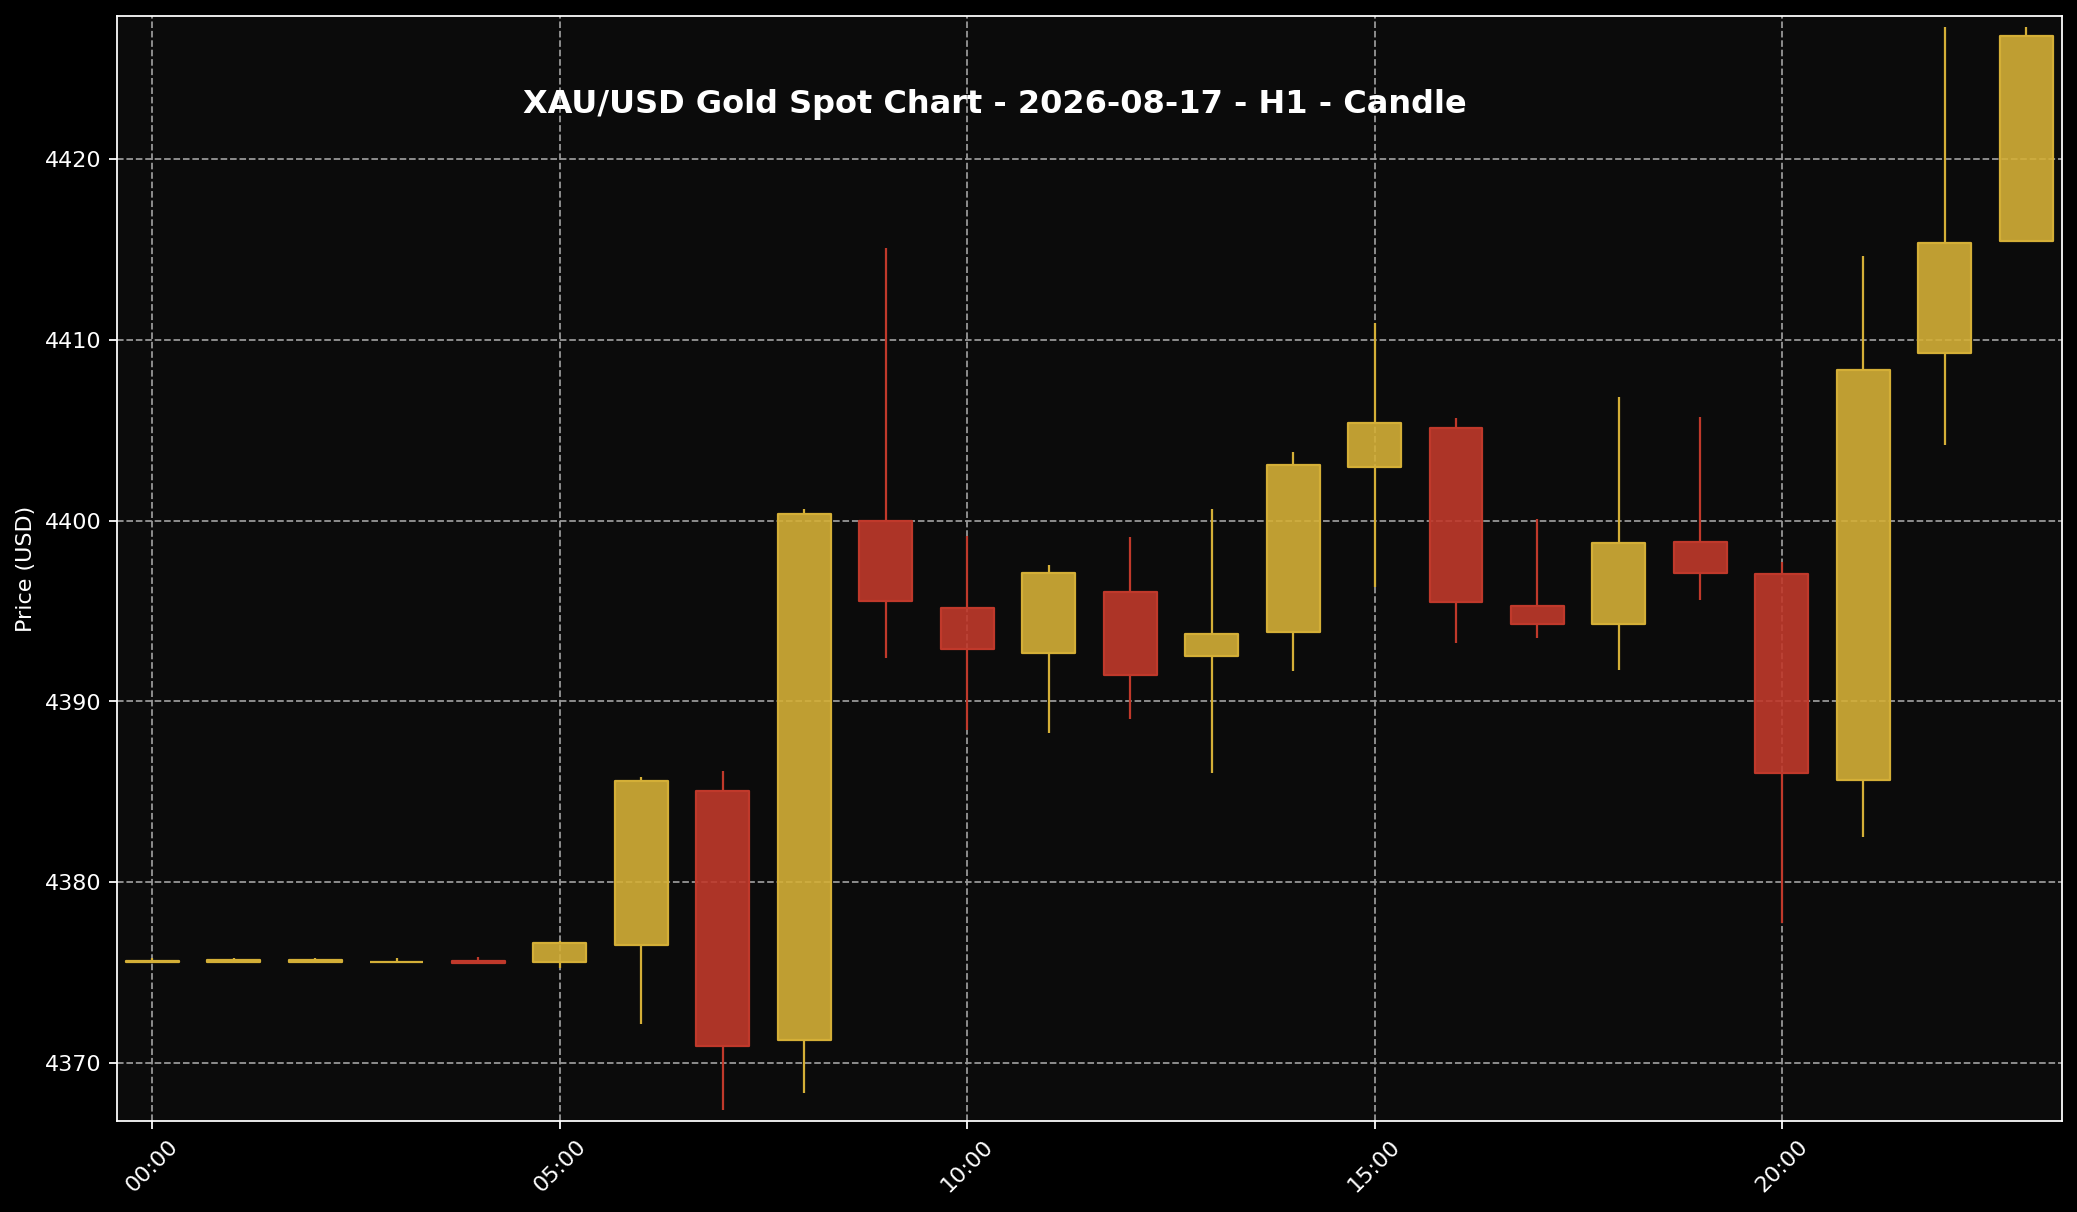 This chart shows the XAU/USD movement for the 17 August 2026 market session. Sifu Gold uses it as a visual reference, not a cue to buy emotionally.
1. At the approved snapshot around 11:00 PM Malaysia time, global spot gold was around USD4,426.83 per troy ounce. Converted into grams, that was about USD142.33 per gram. Using USD/MYR around 4.06003, the same global spot reference worked out to roughly RM17,973.06 per troy ounce, or about RM577.85 per gram. These Ringgit figures are global spot conversions, not local physical retail gold prices in Malaysia.
2. The main support came from a softer US dollar and lower expectations of another Federal Reserve rate hike. Put simply, when the dollar is not too strong, gold usually gets a bit more room because global gold is priced in USD. When the market also feels that the Fed may not need to push rates higher so aggressively, some pressure comes off gold as well.
3. Still, I would not read this as a clean runaway move for gold. The same session also had pressure from higher Treasury yields, helped by a jump in oil prices. When yields rise, some investors may prefer interest-paying assets over gold, because gold itself does not pay interest. So the cleaner reading is this: gold was supported, but it was not completely free from pressure.
What Is The Gold Chart Showing?
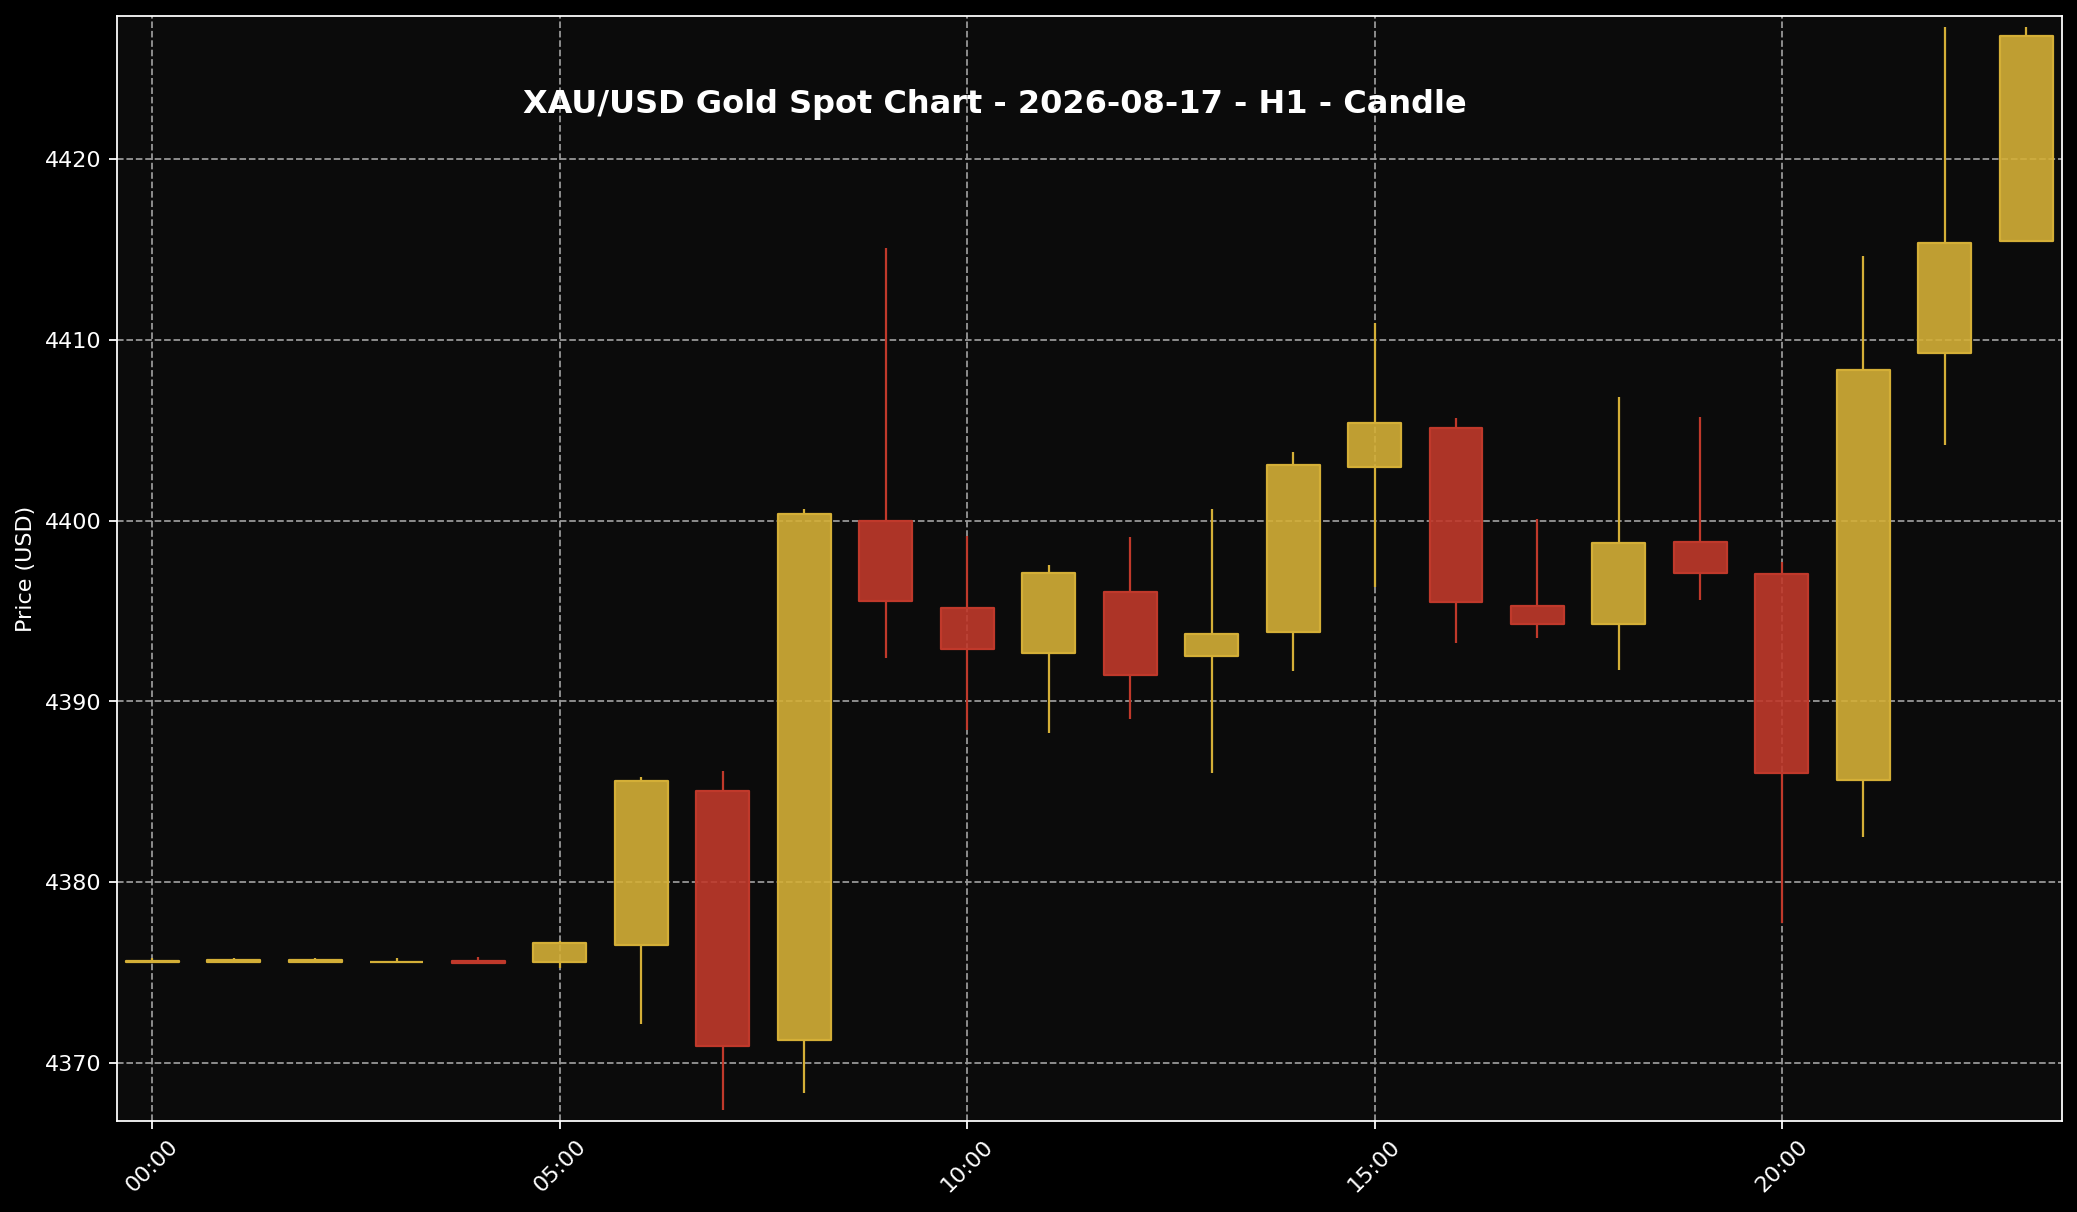 This chart helps readers see the gold price structure for the 17 August 2026 market session. It is used as market context and price-structure reference only.
1. Looking at the H1 XAU/USD chart, gold did not move in a straight line from start to finish. The early part of the session looked more mixed, with price moving up and down before the later session showed clearer support. For readers who are not traders, XAU/USD simply means the global spot gold price quoted in US dollars.
2. The interesting part is near the end of the referenced session. The final H1 candle in the approved 11:00 PM Malaysia snapshot opened around USD4,415.44 and closed around USD4,426.83. That close was near the upper part of the candle range. In plain English, gold did not end that snapshot looking weak. There was still buying support visible near the end.
3. This chart reading should stay as market structure only. It is not a buy or sell signal. For Sifu Gold readers, the chart is useful because it helps us see whether the market story matches the price movement. In this case, the chart fits the news flow: gold had support late in the session, even though the wider market still had yield pressure in the background.
Why Did Gold Move This Way?
 The US dollar is often one of the key factors influencing gold prices. When the dollar is firmer, gold can face more noticeable pressure.
1. The story is quite straightforward. When the market reduces the chance of another Fed rate hike, gold usually gets some relief. Gold does not pay dividends or interest. So when interest rates are expected to go higher, gold can look less attractive compared with assets that do pay a return. When that expectation eases, gold gets more space to breathe.
2. The weaker US dollar also helped. Global gold is priced in USD. When the dollar strengthens, buyers using other currencies may need to pay more for the same amount of gold. When the dollar weakens, that pressure is reduced. That is why the combination of a softer dollar and fading Fed-hike worries gave gold support on 17 August 2026.
3. But there was still one brake on the move. Higher oil prices pushed Treasury yields up, and higher yields can make it harder for gold to rise too freely. So the day was not simply “gold is strong, full stop”. A better way to read it is this: the dollar and Fed story helped gold, but rising yields kept the market from looking fully comfortable.
What Does This Mean For Gold Savers?
 For Malaysian gold savers, the key point is to understand the gap between global spot price and local physical price, then act according to budget and discipline.
1. The way I see it at Sifu Gold, daily gold movement is best used as a check-up, not as a reason to react emotionally. For Malaysian gold savers, 17 August 2026 showed that gold still had support when pressure from the US dollar and Fed expectations eased. At the same time, it reminds us that gold can still move up and down when yields and other macro factors change.
2. One key point for physical gold buyers: global spot price is not the same as local physical gold price. The RM577.85 per gram figure above is only a converted global spot reference based on USD/MYR around 4.06003. Local physical gold prices can differ because of product premium, buy-sell spread, operating cost, logistics and the local pricing structure in Malaysia.
3. If you already have a monthly gold-saving budget, buying in small stages is usually easier to manage than chasing one daily price. If the budget is tight, there is no need to force it. Check commitments, emergency cash, current physical gold price and spread first. The bigger goal is to build grams with discipline, not to commit the full budget at once just because one day’s price looks active.
Conclusion
Gold found support on 17 August 2026 because the US dollar weakened and expectations of another Fed rate hike eased. At the same time, higher Treasury yields linked to the oil price jump still limited how freely gold could move. So the market story was mixed: gold had support, but it had not fully escaped pressure. For Malaysian gold savers, my approach is simple. Use the daily move as a guide. Check the spot price, check USD/MYR, and check the current local physical gold price before making a decision. If the budget is already set aside, small staged buying can still fit a long-term plan. If the timing or cash flow does not feel suitable, waiting and reorganising the budget is also a disciplined decision. For those who want to start small, Gold Accumulation Program by Public Gold lets you begin saving gold from as low as RM100, based on your own affordability.

