


What happened to gold on 21 August 2026? Gold moved strongly and stayed above USD4,600 per troy ounce. The story was not just one thing. The US dollar weakened, the market became less worried about aggressive US rate hikes, and concerns about America’s fiscal position kept gold attractive. For Malaysian gold savers, the useful part is not only the USD price. It is also how that global price looks once we translate it into Ringgit.
- Introduction
- What Happened To Gold On 21 August 2026?
- What Is The Gold Chart Showing?
- Why Did Gold Move This Way?
- What Does This Mean For Gold Savers?
- Conclusion
What Happened To Gold On 21 August 2026?
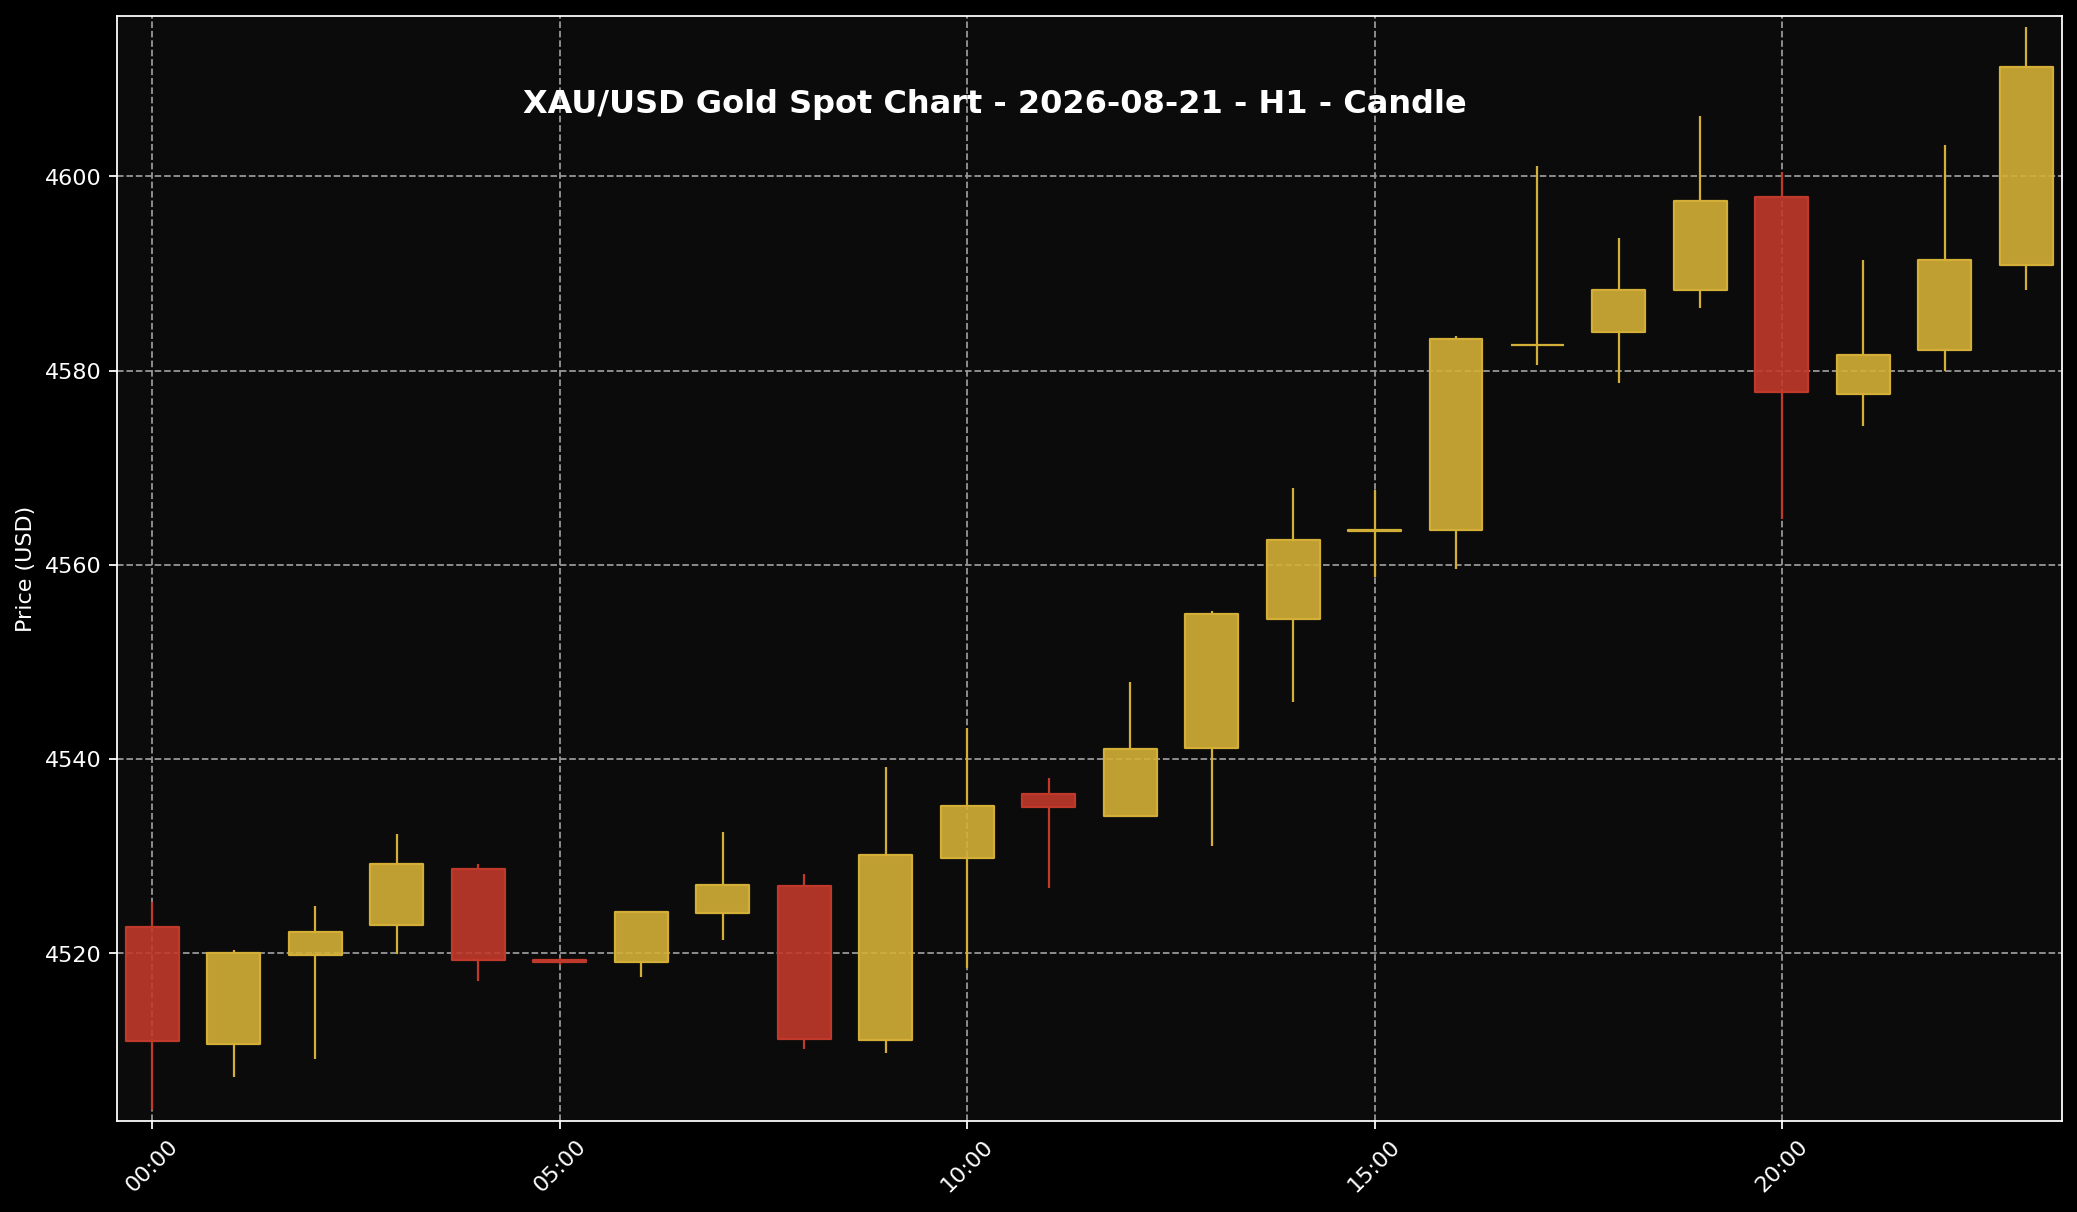 This chart shows the XAU/USD movement for the 21 August 2026 market session. Sifu Gold uses it as a visual reference, not a cue to buy emotionally.
1. At the 11:00 PM Malaysia time snapshot, global spot gold was around USD4,611 per troy ounce. In gram terms, that works out to roughly USD148.26 per gram. Using the USD/MYR rate of about 4.03915 at the same snapshot, the global spot conversion comes to around RM18,626 per troy ounce, or roughly RM599 per gram. This is the global spot price converted into Ringgit. It is not the same as local physical retail gold pricing in Malaysia.
2. The big story was that gold managed to stay above the USD4,600 area. Gold-specific market coverage pointed to a weaker US dollar, less pressure from September Fed-hike expectations, and ongoing worries about US fiscal strength. Put simply, the market had more reasons to hold gold than to move away from it during that session.
3. I would not read this as a one-way story with no risk. US Treasury yields were still elevated, and higher yields can still make it harder for gold to keep rising. But on 21 August, the weaker dollar, fiscal concerns, and stronger price structure carried more weight than that yield pressure.
What Is The Gold Chart Showing?
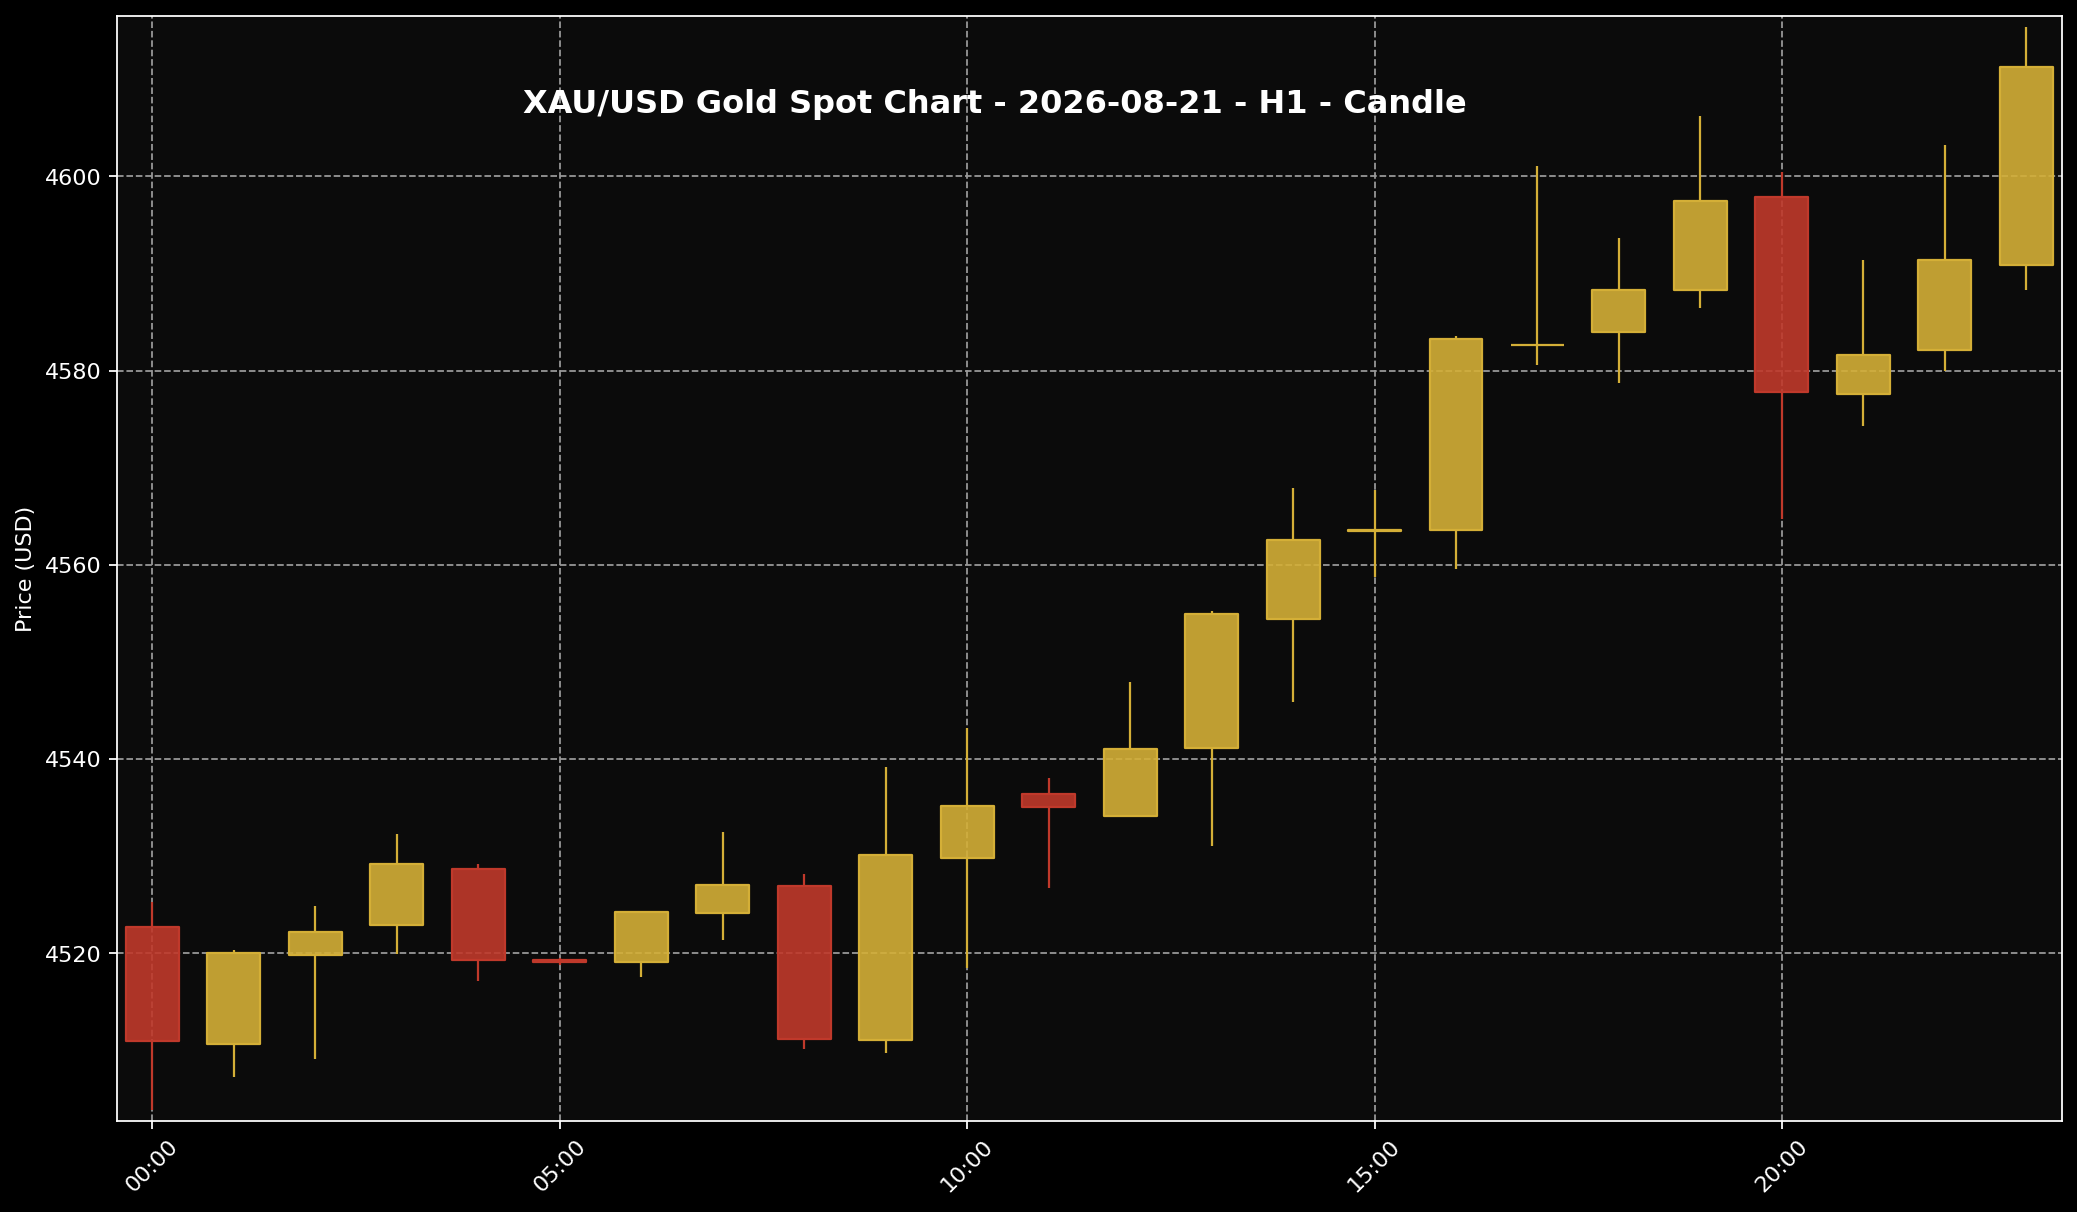 This chart helps readers see the gold price structure for the 21 August 2026 market session. It is used as market context and price-structure reference only.
1. Looking at the H1 XAU/USD chart, gold moved clearly from around the USD4,510 area towards the USD4,600 area and above. Earlier in the session, price was still nearer the lower part of the chart. After that, buyers became more active, and the candles started stepping into higher levels.
2. The USD4,580 to USD4,600 area looked important during the session. Price moved around that zone a few times before trying to push higher. This is not a trading setup, and it is not a signal. It is just a simple chart reading: gold was not merely moving sideways. It was showing stronger momentum after moving through the psychological USD4,600 level.
3. Still, when price has already moved far in one day, gold savers do not need to read the chart like traders. For me at Sifu Gold, the chart is better used as a checking tool. It helps us see whether the market is strong, weak, or still searching for direction. For 21 August, the chart showed buyers were still active near the higher area.
Why Did Gold Move This Way?
 The US dollar is often one of the key factors influencing gold prices. When the dollar is firmer, gold can face more noticeable pressure.
1. The first reason was the weaker US dollar. Global gold is usually priced in USD. When the dollar falls, gold can become more attractive to buyers outside the United States because the cost in other currencies can feel less demanding. That is why a softer US dollar often gives gold more room to rise.
2. The second reason came from the US interest-rate story. When the market becomes less worried about aggressive rate hikes, some pressure can come off gold. Gold does not pay interest like a bond. So when rates are expected to stay very high, gold can find it harder to move. When that pressure eases a little, gold gets more room to breathe.
3. The third reason was concern about US fiscal strength and debt sustainability. When investors worry about government finances or bigger market risks, some of them look for assets they believe can hold value over time. That is where gold often gets attention. Market reports also showed gold reaching a three-month high, helped by the weaker dollar and a price structure that was still supportive.
What Does This Mean For Gold Savers?
 For Malaysian gold savers, the key point is to understand the gap between global spot price and local physical price, then act according to budget and discipline.
1. For gold savers, a strong daily move like this is useful as a market check, not a reason to act emotionally. If gold is rising fast, the better question is simple: are you saving gold for the long term, or are you trying to chase a one-day price move?
2. For Malaysian readers, numbers like USD4,611 per troy ounce and roughly RM599 per gram help give a clearer picture. But global spot gold is not the same as local physical gold. Physical gold pricing can include premiums, buy-sell spread, product costs, operating costs, logistics, local pricing structure, and the USD/MYR exchange rate.
3. If you already have a monthly gold-saving budget, buying in smaller stages still makes more sense than committing the full budget at once. If the price feels high after a strong rally, check your cash flow first. If the budget is tight, there is no need to force it. The main goal is not to guess the lowest price perfectly, but to build grams according to your own ability and discipline.
Conclusion
Gold moved strongly on 21 August 2026 and stayed above USD4,600 because several stories came together at the same time: the US dollar weakened, pressure from US rate-hike expectations eased, and concerns about America’s fiscal position kept interest in gold alive. Treasury yields were still elevated, so this rally should not be treated as a guaranteed direction for what comes next. For Malaysian gold savers, I would read this as a time to review the saving plan. If the budget is already there, keep building according to ability. If the price feels stretched, review the cash flow first and avoid decisions driven by FOMO. For those who are just starting, the Gold Accumulation Program by Public Gold allows you to start saving gold from as low as RM100, which can be a practical way to build grams gradually according to your own budget.

