


What happened to gold on 23 August 2026 needs a slightly different reading. This was not a normal completed weekday session. It was a Sunday reopen-window market date, so the fairest comparison is still the last completed Friday session on 21 August 2026. From that Friday reference, gold entered the new week with support from a weaker US dollar, fiscal-risk worries and geopolitical uncertainty. For Malaysian gold savers, this update is better treated as an early-week reference, not a final conclusion on the week’s direction.
- Introduction
- What Happened To Gold On 23 August 2026?
- What Is The Gold Chart Showing?
- Why Did Gold Move This Way?
- What Does This Mean For Gold Savers?
- Conclusion
What Happened To Gold On 23 August 2026?
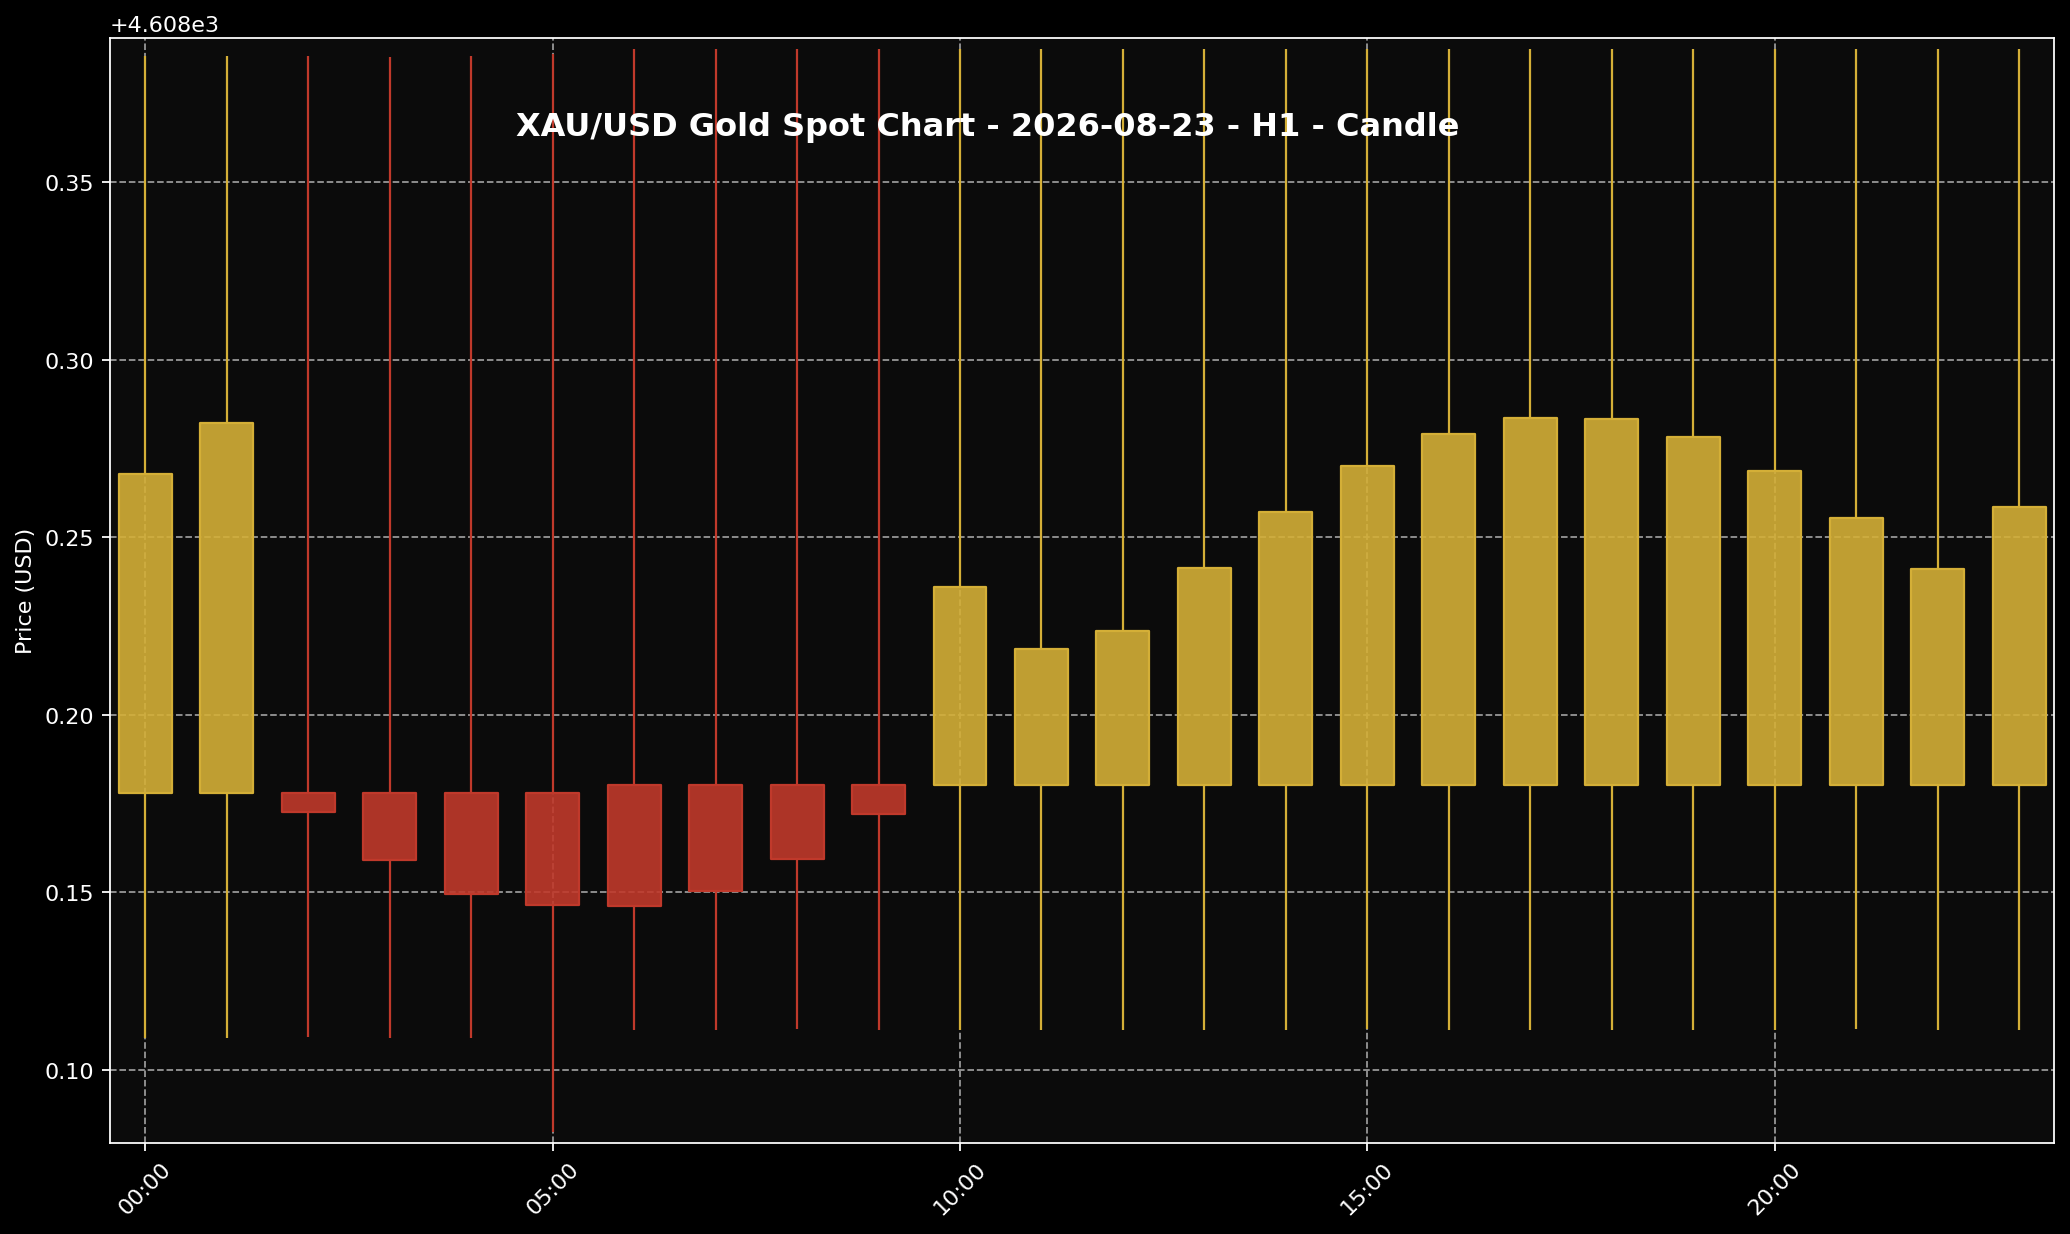 This chart shows the XAU/USD movement for the 23 August 2026 market session. Sifu Gold uses it as a visual reference, not a cue to buy emotionally.
1. On 23 August 2026, the global gold reference was around USD4,608.26 per troy ounce at about 11:00 PM Malaysia time. In gram terms, that works out to roughly USD148.16 per gram. Using USD/MYR around 4.0393, the same global spot reference was about RM18,614.14 per troy ounce, or roughly RM598.46 per gram. This is a global spot conversion into Ringgit, not a local physical retail gold price in Malaysia.
2. The important point is the timing. Because 23 August fell inside the early reopening of the new trading week, it should not be read as though a full fresh trading session had already finished and delivered a complete new market story. For a Sunday market-date article like this, the last completed Friday session on 21 August 2026 remains the fairest anchor.
3. Put simply, gold was still being watched near high levels as the new week opened. The number around USD4,608.26 looks strong on its own, but the better reading is this: gold carried forward support from Friday, while the market still needed more full-session activity before the new week’s direction could be judged more clearly.
What Is The Gold Chart Showing?
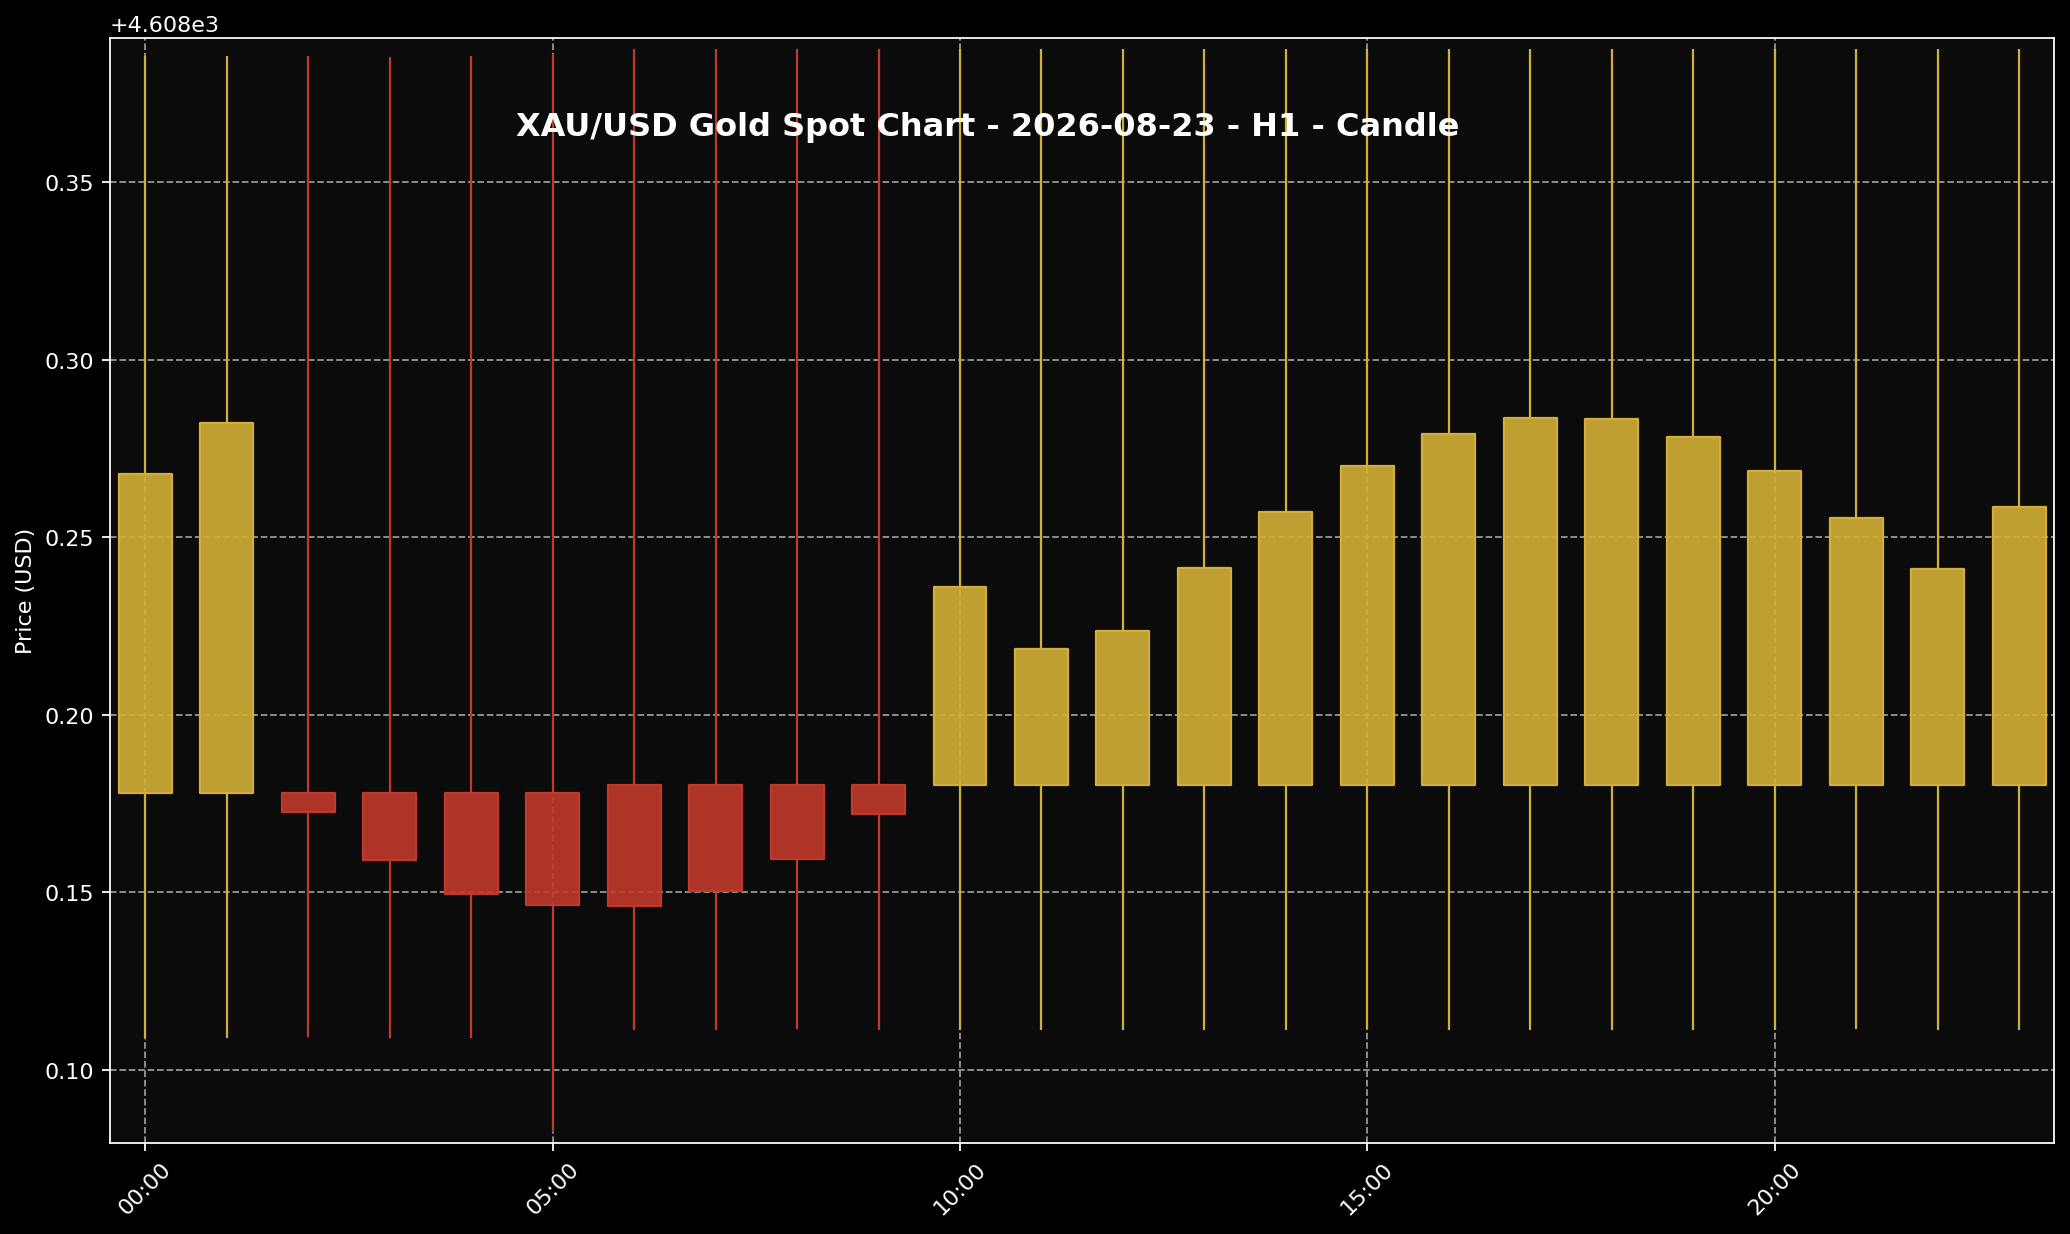 This chart helps readers see the gold price structure for the 23 August 2026 market session. It is used as market context and price-structure reference only.
1. The H1 XAU/USD chart for 23 August 2026 showed gold moving in a fairly tight range near elevated levels. There was no clear heavy sell-off in the chart reference. At the same time, there was also no strong fresh breakout that would justify calling it a fully confirmed new upward move.
2. If we keep the chart reading simple, gold looked like it was trying to settle into an early-week reference zone. Some candles showed mild pressure earlier, then price moved back around the upper part of the small range. This is not a buy or sell signal. It is just a way to describe market structure: gold had not collapsed, but it had also not given a clear new direction yet.
3. That matters because weekend-to-new-week pricing can sometimes feel more sensitive than a normal weekday session. Participation is not always the same as a full market day. So for Sifu Gold readers, the chart is useful as a price-position check, not as a reason to chase the market.
Why Did Gold Move This Way?
 The US dollar is often one of the key factors influencing gold prices. When the dollar is firmer, gold can face more noticeable pressure.
1. The main story still comes from the last completed Friday session on 21 August 2026. Kitco’s Friday notes pointed to gold and silver extending their rally as a weaker US dollar helped precious metals. The same Friday backdrop also included fiscal-risk hedging and uncertainty around the Strait of Hormuz, both of which kept gold supported near higher levels.
2. Reuters reports from the completed Friday session also pointed in a similar direction. Gold was steadying and heading for a third straight weekly gain, while another report highlighted a move near a three-month high as the weaker dollar and supportive market structure helped gold. In simple terms, gold did not enter the new week from a blank starting point. It carried a supportive story from Friday.
3. Still, one thing needs to stay clear. Those drivers belong mainly to the last completed session, not to a fully finished Sunday market story. So the safer reading for 23 August is this: gold entered the new week with carry-over support, while the market was still waiting for fuller weekday trading before giving a cleaner signal on direction.
What Does This Mean For Gold Savers?
 For Malaysian gold savers, the key point is to understand the gap between global spot price and local physical price, then act according to budget and discipline.
1. For Malaysian gold savers, this kind of price move is best used as a planning reference. Gold was still near a high global reference around USD4,608.26 per troy ounce, so the market had not suddenly turned weak. But because this was still an early-week reopen reading, it makes more sense to treat it as a checkpoint rather than a final call on where gold must go next.
2. Also, the global spot price is not the same as the local physical price people see in Malaysia. The RM598.46 per gram figure is only the global spot price translated into Ringgit using USD/MYR around 4.0393. Local physical gold prices can be different because they include product premiums, buy-sell spreads, operating costs, logistics and local pricing structure.
3. From a saver’s point of view, the practical step is still about budget and discipline. If you already have a monthly gold-saving budget, buying bit by bit can make more sense than committing the full budget at once. If cash flow is tight, there is no need to force it. Check your commitments first, protect your basic savings, and let the decision come from your saving plan rather than fear of missing one price move.
Conclusion
The conclusion for 23 August 2026 is quite simple. Gold entered the new trading week near high levels, but the fairest reference point remains the last completed Friday session on 21 August 2026. That Friday backdrop was supported by a weaker US dollar, fiscal-risk worries and geopolitical uncertainty, while the Sunday reopen-window price gave an early reference rather than a full new session verdict. For Malaysian gold savers, the main focus is not to guess the perfect price. The better focus is to understand the difference between global spot gold and local physical pricing, watch how USD/MYR affects the Ringgit view, and keep buying decisions tied to budget. If you want to build grams gradually, the Gold Accumulation Program by Public Gold allows you to start saving gold from as low as RM100, based on your own affordability and discipline.

