


What happened to gold on 28 August 2026? Gold came under clear pressure after the market turned its attention back to the US interest-rate story. Earlier in the session, gold was still moving near the USD4,600 per troy ounce area. But once Fed Chair Kevin Warsh’s comments made traders rethink the risk of rates staying high or moving higher, gold started to lose strength. For Malaysian gold savers, the useful point is not just the USD price. It is also how that global price looks once translated into Ringgit.
- Introduction
- What Happened To Gold On 28 August 2026?
- What Is The Gold Chart Showing?
- Why Did Gold Move This Way?
- What Does This Mean For Gold Savers?
- Conclusion
What Happened To Gold On 28 August 2026?
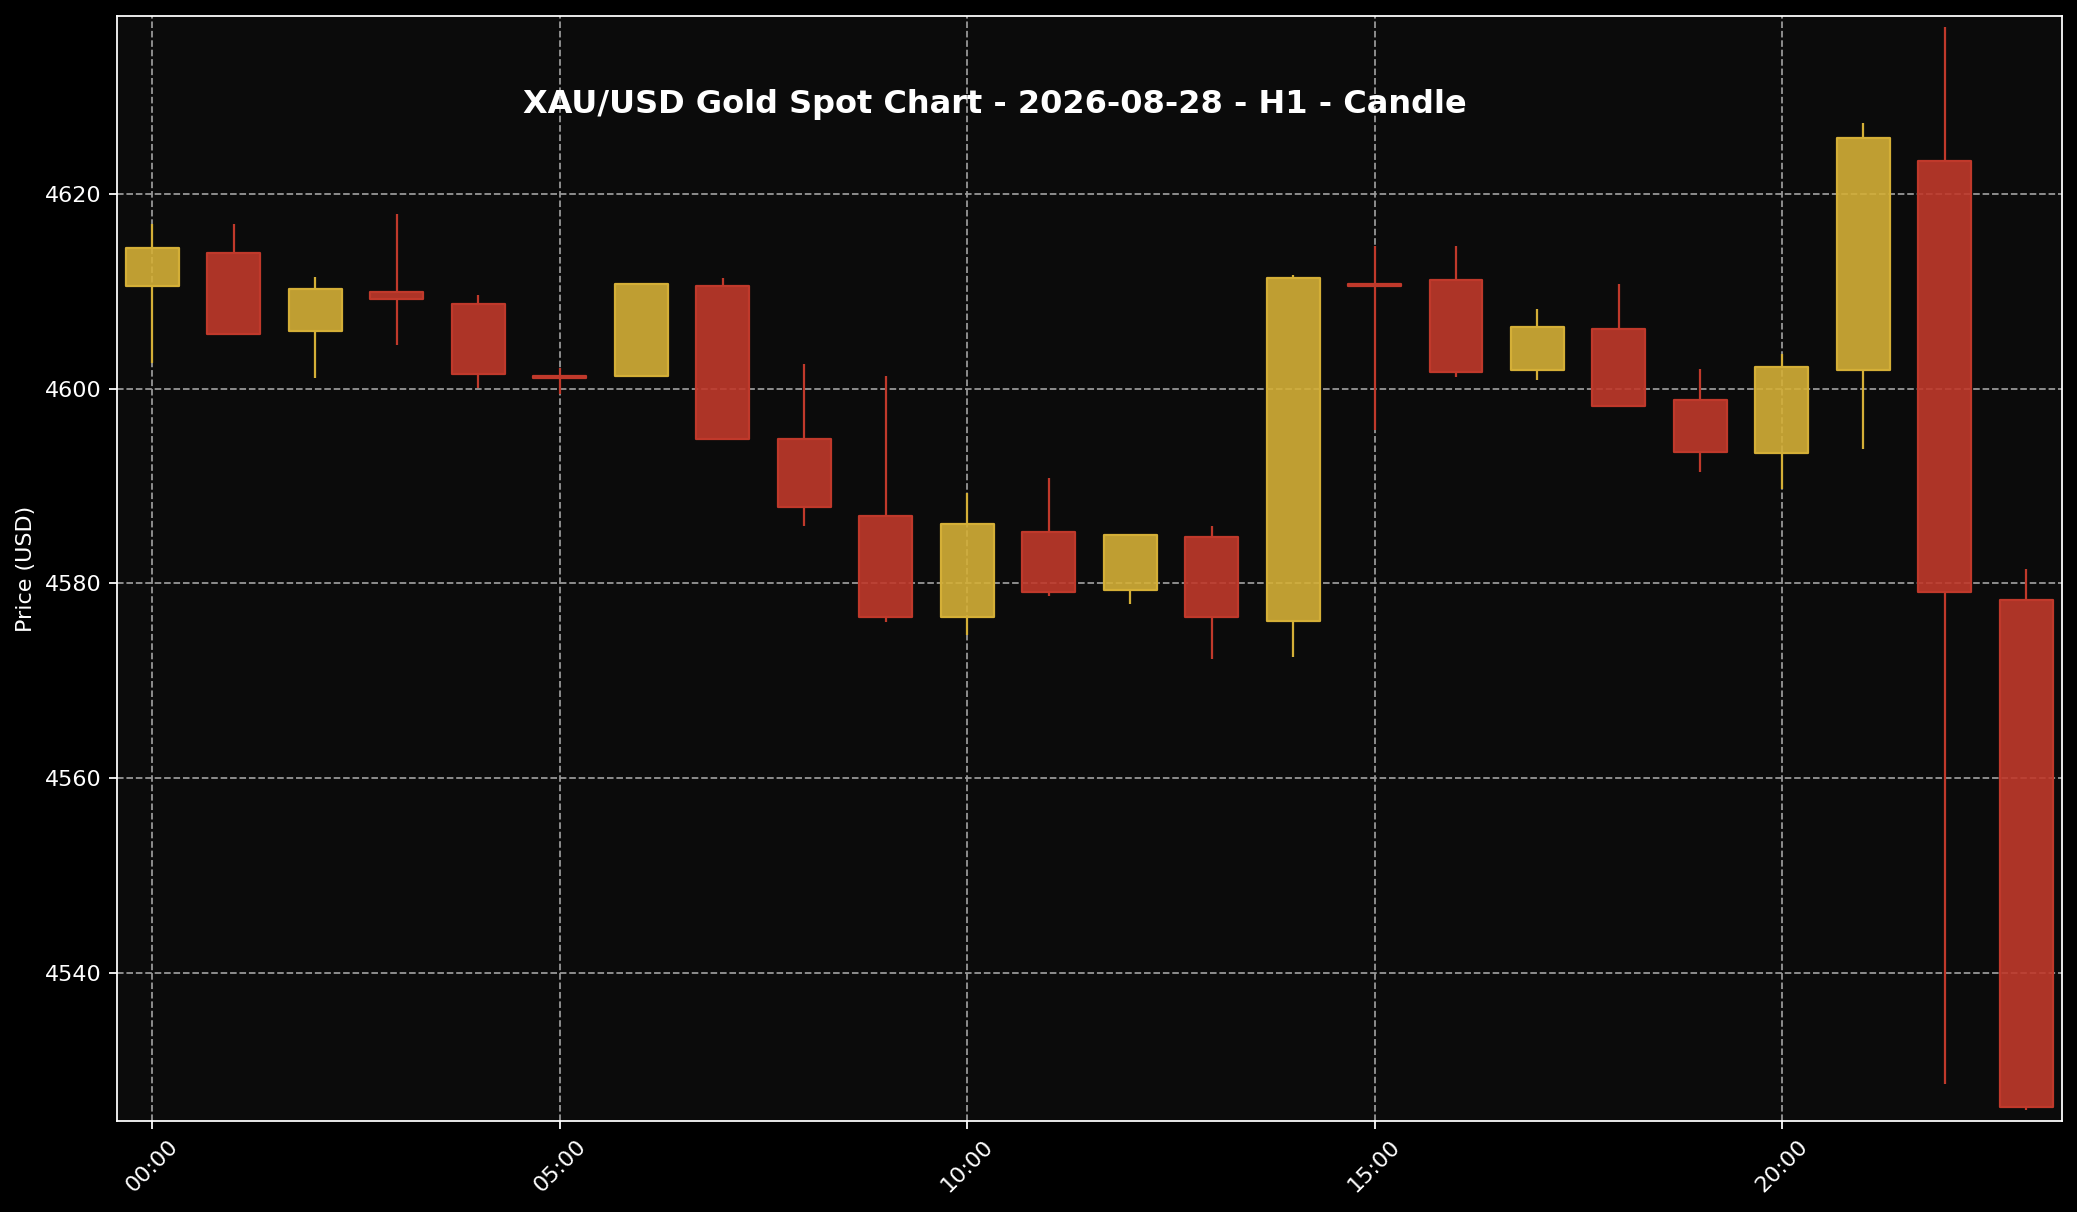 This chart shows the XAU/USD movement for the 28 August 2026 market session. Sifu Gold uses it as a visual reference, not a cue to buy emotionally.
1. On 28 August 2026, the approved XAU/USD snapshot showed global gold around USD4,526.24 per troy ounce at 11:00 PM Malaysia time. Converted into grams, that was about USD145.52 per gram. With USD/MYR around 4.02599 at the same snapshot time, the global spot reference was roughly RM18,222.58 per troy ounce, or about RM585.87 per gram.
2. That Ringgit number is only a conversion of the global spot price. It is not the same as the retail price of physical gold in Malaysia. Local physical gold pricing can include product premium, buy-sell spread, local pricing structure, operating cost, logistics and the movement of USD/MYR. So when we see USD4,526.24 or about RM585.87 per gram, treat it first as the world market reference.
3. The main story was not simply that gold fell. The bigger point was that the market changed its tone after the Fed comments brought inflation and interest rates back into focus. When traders think US rates may stay high, gold usually finds it harder to climb. Gold does not pay interest like bonds, so some investors start comparing gold again with assets that offer a yield.
What Is The Gold Chart Showing?
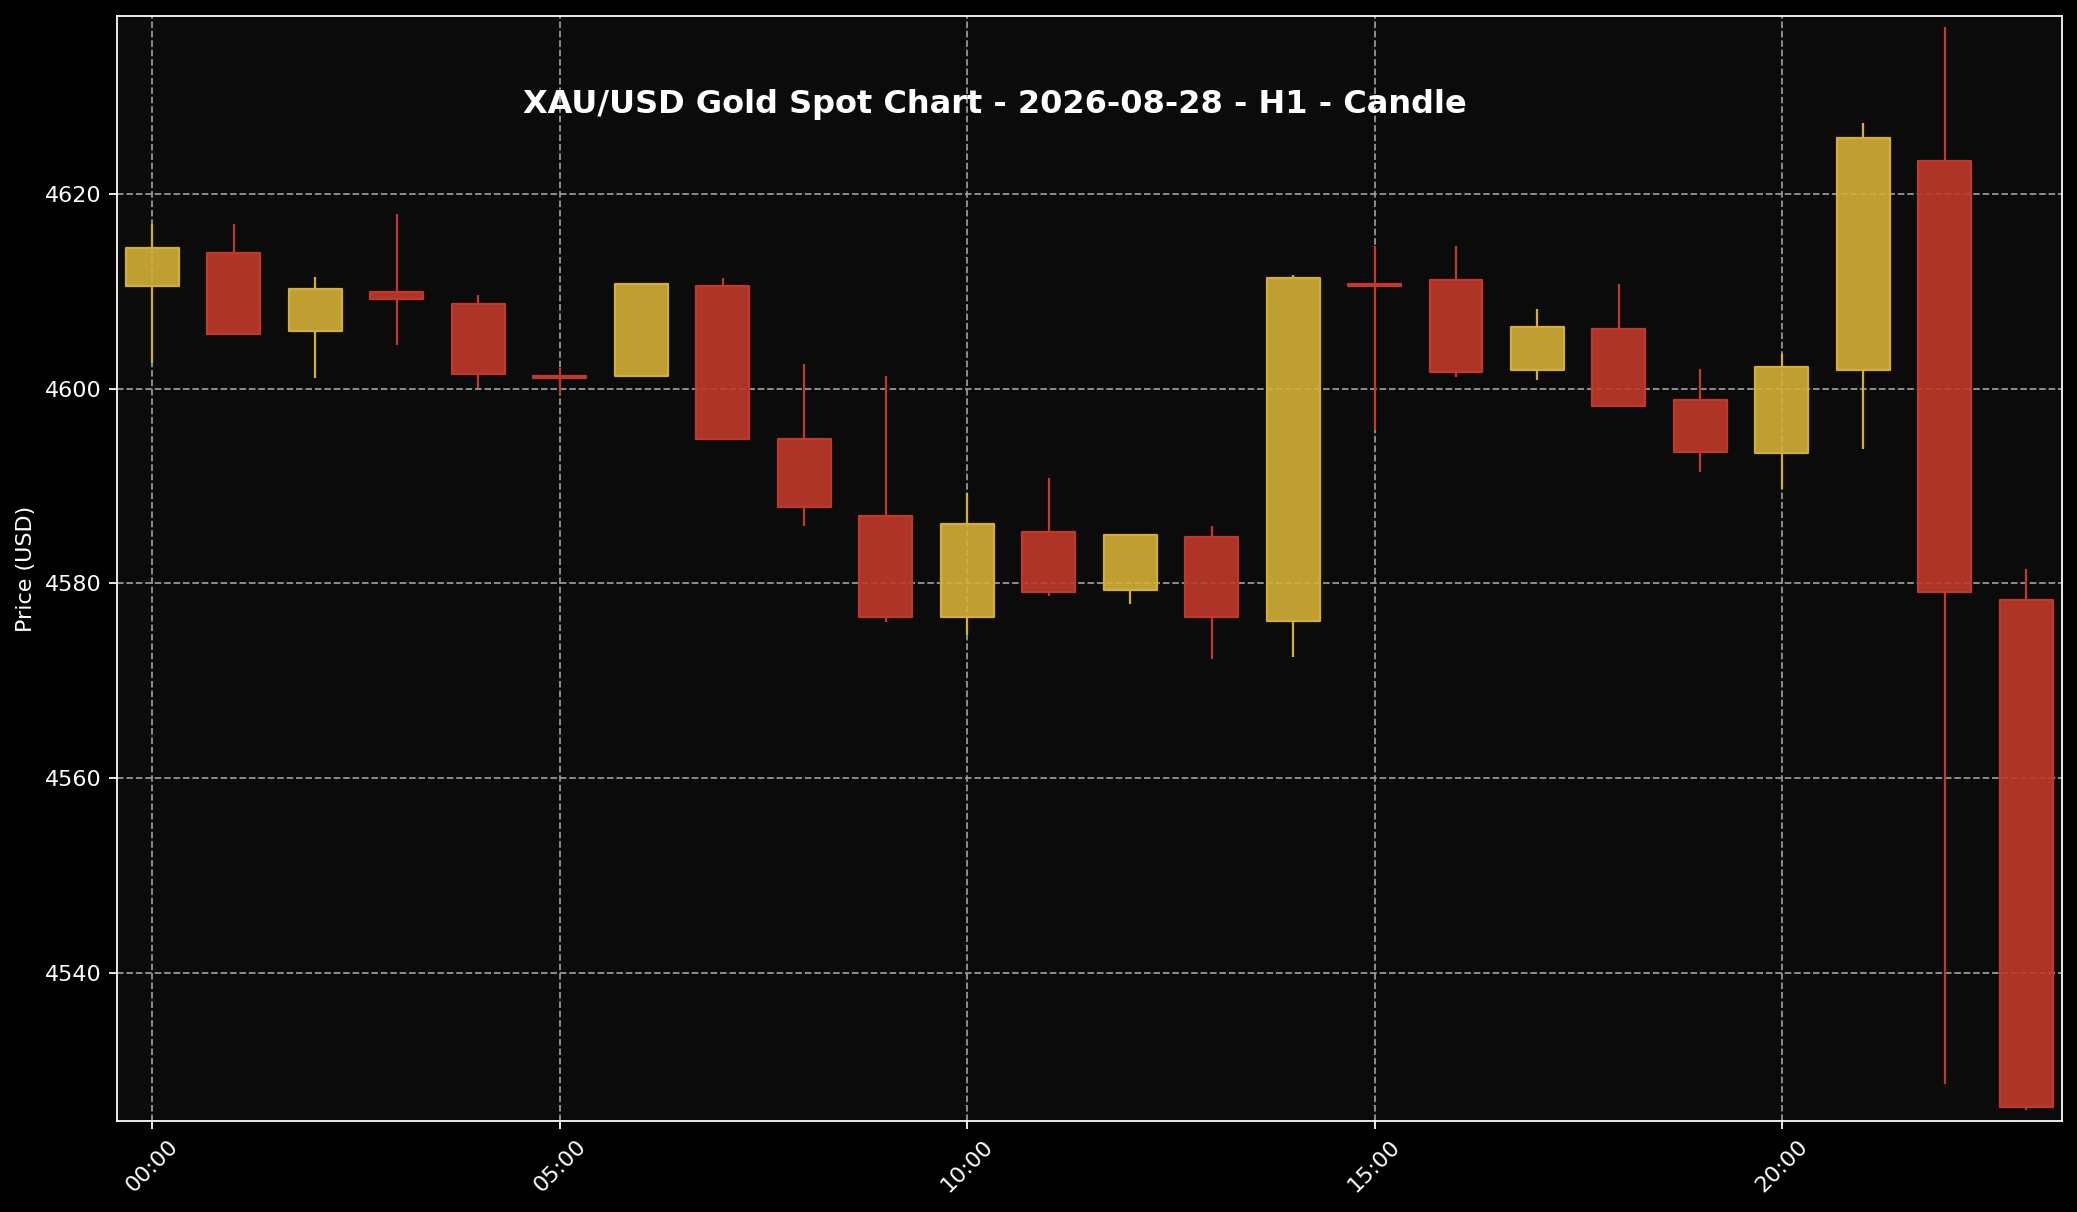 This chart helps readers see the gold price structure for the 28 August 2026 market session. It is used as market context and price-structure reference only.
1. If we look at the H1 chart for 28 August 2026, gold spent much of the earlier session around the upper USD4,570 area and even moved above USD4,600 at points. There were moments where gold tried to hold the higher area, but that strength did not last into the approved late-session snapshot.
2. The final H1 candle opened around USD4,578.27, reached about USD4,581.48, then fell to around USD4,525.91 before closing near USD4,526.24. Put simply, sellers were still active late in the session. Gold did not just dip slightly and recover. It ended the snapshot hour very close to the lower end of that candle.
3. This chart reading is not a trading signal. For Sifu Gold readers, the chart is useful because it helps us understand the market structure. Gold tried to stay higher earlier, but it could not hold that area once the Fed rate story became stronger in the market’s mind. So the chart supports the same basic message: late-session pressure was clear.
Why Did Gold Move This Way?
 The US dollar is often one of the key factors influencing gold prices. When the dollar is firmer, gold can face more noticeable pressure.
1. The main trigger came from Fed Chair Kevin Warsh’s Jackson Hole comments. Before the speech, the market was already waiting for clues on where US interest rates might go next. When his remarks brought the focus back to inflation and the possibility of a tighter rate path, traders started to reassess the rate story.
2. Put simply, if the market thinks the Fed may not be done fighting inflation, traders may expect US interest rates to stay higher for longer, or even price in higher-rate risk again. In that kind of environment, the US dollar and US bond yields can get support. A bond yield is the return investors can receive from holding government bonds. When that return looks more attractive, gold can become less appealing in the short term because it does not pay interest.
3. That is why gold fell more sharply after the comments. It does not mean the long-term case for gold disappeared overnight. It means the daily market was reacting to the interest-rate story. Some days gold moves because of physical demand. Some days it moves because of geopolitics. On 28 August, the market was highly sensitive to the Fed’s tone.
What Does This Mean For Gold Savers?
 For Malaysian gold savers, the key point is to understand the gap between global spot price and local physical price, then act according to budget and discipline.
1. The way I see it at Sifu Gold, daily gold moves are better used as a check-in, not as a reason to react emotionally. When gold falls because of the Fed story, it means the market is reassessing interest rates, the US dollar and bond yields. For Malaysian gold savers, the focus is not to guess the lowest price. The focus is to understand why the price moved and how it fits into your own saving plan.
2. One thing is worth keeping clear: global spot gold is not the same as local physical gold pricing. Even though the global spot conversion was around RM585.87 per gram at this snapshot, the physical gold price people see in Malaysia can be different. USD/MYR matters, but so do product premium, spread and local pricing structure. That is why the global number is a helpful reference, not a direct retail price.
3. If you already have a monthly gold-saving budget, small staged buying can still be considered according to your own plan. If your budget is tight, there is no need to force it just because gold fell for one day. Break the budget into smaller parts, protect household commitments, and do not commit the full budget at once. In gold saving, building grams with discipline usually matters more than trying to catch one perfect price.
Conclusion
Gold fell on 28 August 2026 because the market returned to the Fed rate story. Kevin Warsh’s comments made traders rethink the risk of US rates staying high, and that put fresh pressure on gold. The H1 chart also showed that pressure clearly, with gold closing near the lower end of the final snapshot candle. For Malaysian gold savers, this is a useful reminder that daily gold prices can move sharply when the global market changes its view on the Fed, the US dollar and bond yields. If you already have a saving plan, stick to a structured budget. If you are just starting, the Gold Accumulation Program by Public Gold lets you begin saving gold from as low as RM100, which can suit those who prefer building grams bit by bit according to affordability.

