


What happened to gold on 1 September 2026? Gold came under pressure after US Treasury yields moved higher and the US dollar strengthened again. When those two move against gold, it becomes harder for the price to stay high. For Malaysian gold savers, the useful point is not just that gold fell. It is more helpful to understand why it dropped, what the chart is showing, and what the global price looks like once it is translated into Ringgit.
- Introduction
- What Happened To Gold On 1 September 2026?
- What Is The Gold Chart Showing?
- Why Did Gold Move This Way?
- What Does This Mean For Gold Savers?
- Conclusion
What Happened To Gold On 1 September 2026?
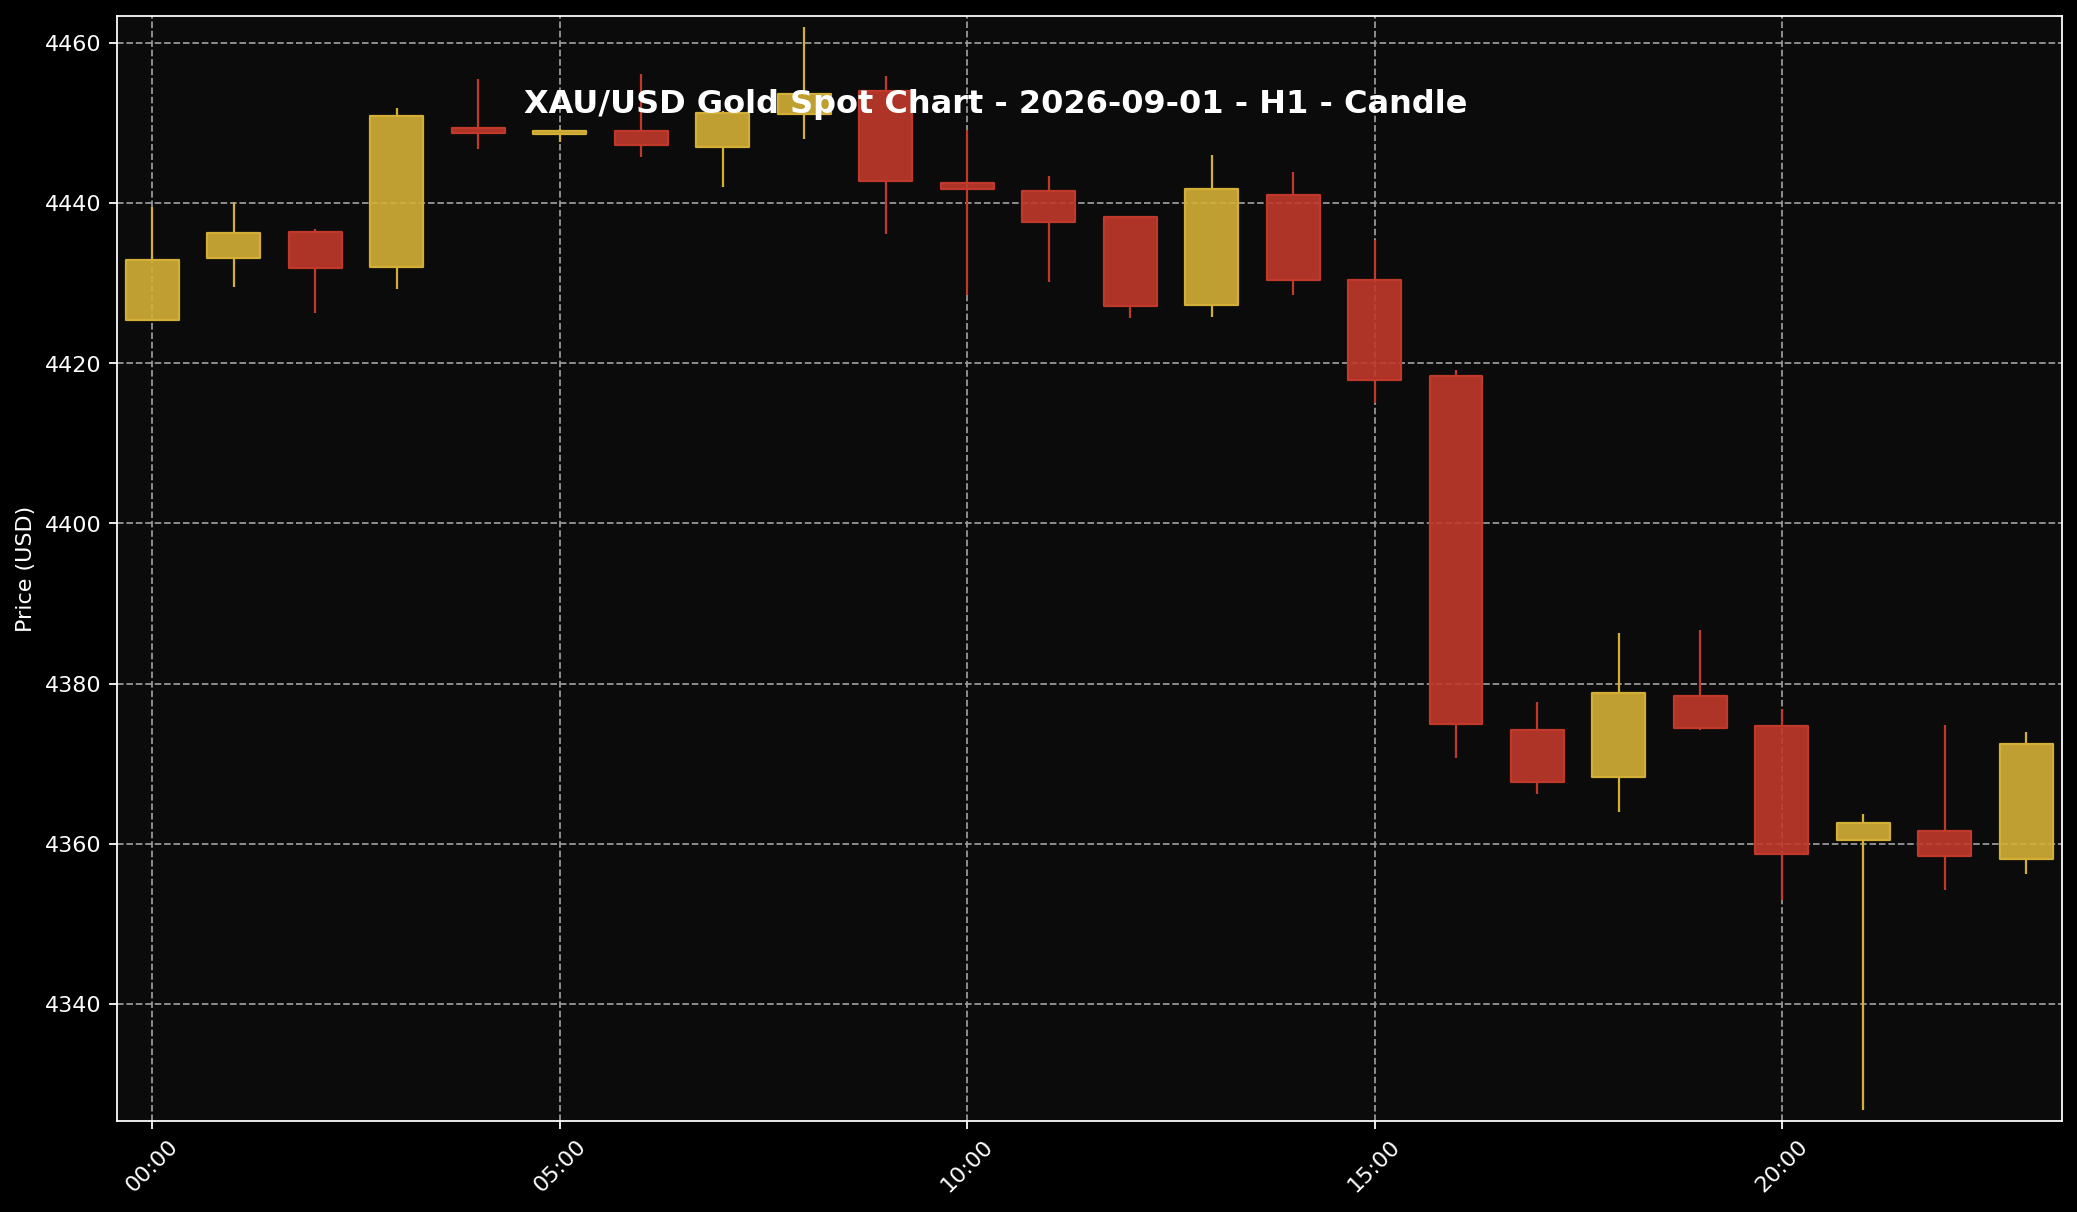 This chart shows the XAU/USD movement for the 1 September 2026 market session. Sifu Gold uses it as a visual reference, not a cue to buy emotionally.
1. On 1 September 2026, gold traded with a weaker tone. The article price reference at around 11:00 PM Malaysia time showed XAU/USD near USD4,372.41 per troy ounce. Broken down into grams, that was about USD140.58 per gram. Using the USD/MYR rate of around 4.03899 at the same snapshot time, the global spot price translated to roughly RM17,660.12 per troy ounce, or about RM567.79 per gram.
2. These Ringgit figures are global spot gold conversions. They are not the same as local physical retail gold prices in Malaysia. The price a buyer sees locally can include product premium, buy-sell spread, product cost, operating cost, logistics and the seller’s current pricing structure. So I would treat this number as a global market reference first, not as a direct shop price.
3. The main story was simple enough. Gold fell into a lower area because US Treasury yields and the US dollar were both pressing against it. Treasury yield simply means the return investors can get from US government bonds. When that return rises, some investors become more interested in interest-paying assets. Gold does not pay interest, so it can look less attractive in the short term even though its longer-term saving role remains relevant.
What Is The Gold Chart Showing?
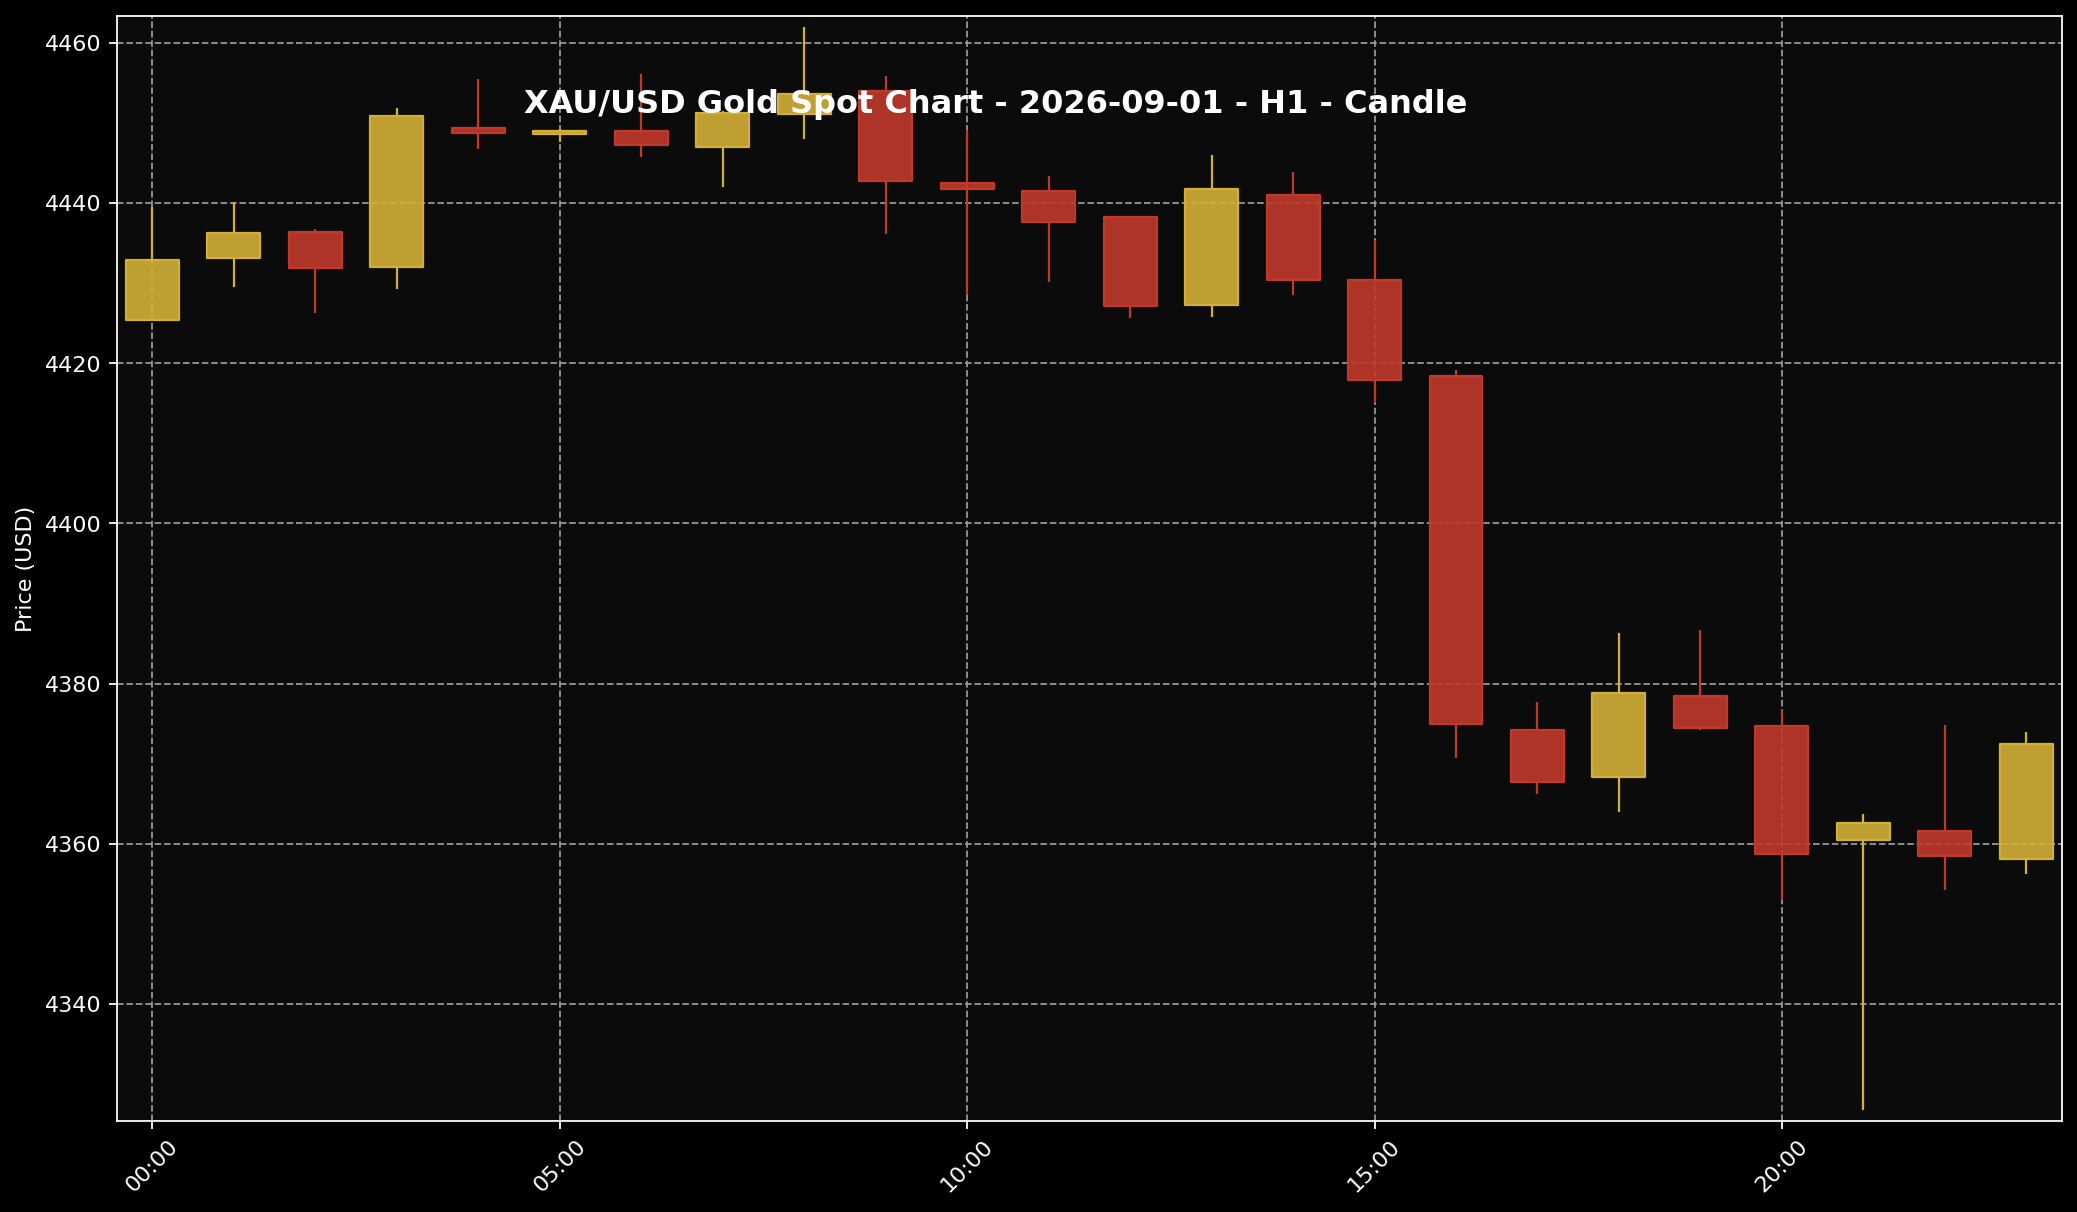 This chart helps readers see the gold price structure for the 1 September 2026 market session. It is used as market context and price-structure reference only.
1. If we look at the H1 XAU/USD chart for 1 September 2026, gold still started the day around the higher area, roughly between USD4,430 and USD4,460. At one point, the price tried to hold near that upper zone. But that early strength did not last. As the session moved on, the candles started to show clearer pressure and gold moved well below the early part of the day.
2. The clearest part of the chart was the drop after gold failed to stay around the USD4,440 to USD4,460 area. Price moved down towards the USD4,370 area and was also pushed lower into the low USD4,300s during the session. Put simply, gold did not just slip a little. It lost its early momentum, and the market looked more cautious after that.
3. But this chart reading is not a buy or sell signal. I am reading it only as price structure. Gold tried to stay higher early on, failed to hold that area, then moved into a lower range later in the session. For a gold saver, the message is straightforward: daily price pressure is part of the market, so saving decisions are better made based on budget and plan, not based on one candle or one sharp move.
Why Did Gold Move This Way?
 The US dollar is often one of the key factors influencing gold prices. When the dollar is firmer, gold can face more noticeable pressure.
1. The clearest pressure came from higher US Treasury yields and a firmer US dollar. When the dollar strengthens, gold, which is priced globally in USD, becomes more expensive for buyers using other currencies. That can slow demand. At the same time, when Treasury yields rise, gold can look less attractive to short-term investors because it does not pay interest.
2. The market was also waiting for US jobs data. This matters because employment numbers can change how investors think about the Federal Reserve, or the Fed, which is the US central bank. If the US economy still looks strong, the market may think the Fed has more room to keep interest rates higher. When the rate story stays tight, gold usually finds it harder to build upward momentum.
3. There were also background factors, including Middle East tensions and oil price movement. But for this session, the stronger pressure came from yields and the dollar. In simple terms, the safe-haven story was still there in the background, but it was not strong enough to cancel out the pressure from bonds and currencies. That is why gold fell even though the wider global backdrop still had several risks being watched.
What Does This Mean For Gold Savers?
 For Malaysian gold savers, the key point is to understand the gap between global spot price and local physical price, then act according to budget and discipline.
1. For me at Sifu Gold, daily moves like this are better used as a review point, not as a reason to react emotionally. When gold falls because the dollar and US yields are rising, it tells us the global market is reassessing risk and return. For Malaysian gold savers, the drop can be a chance to review the saving plan, but not a reason to go in heavily all at once.
2. One point has to be clear: XAU/USD is not the same as local physical gold pricing. XAU/USD is the global gold price in US dollars. When converted into Ringgit, the spot reference was around RM567.79 per gram at the 11:00 PM Malaysia time snapshot. But local physical prices can differ because of product premium, buy-sell spread, logistics, operating cost and the current local pricing structure.
3. So what can a saver do? If there is already a monthly gold-saving budget, small staged buying can be considered according to affordability. If cash flow is tight, there is no need to force it. Home commitments, family needs, basic savings and emergency funds should come first. The better focus is to build grams consistently, understand the spread, and avoid committing the full budget at once just because gold fell for one day.
Conclusion
The takeaway for 1 September 2026 is quite clear. Gold fell because US Treasury yields and the US dollar put pressure on prices, while the market was still waiting for US jobs data to read the next direction for Fed expectations. The chart also showed gold failing to hold its early higher area before moving into a lower zone later in the day. For Malaysian gold savers, I would read a day like this as a time to review the plan, not chase the price. Separate global spot gold from local physical gold pricing. If there is a dedicated budget, build slowly according to your own plan. If it still does not feel comfortable, check cash flow first. For those who are just starting to build grams, the Gold Accumulation Program by Public Gold allows gold saving to begin from as low as RM100, which can suit a staged approach based on personal budget.

