


What happened to gold on 1 August 2026? The price reading that day is better treated as a weekend reference, because the main market story still came from the last full session before the weekend. Gold was sitting around USD4,042.77 per troy ounce, but it did not show a strong new direction. For Malaysian gold savers, the useful point is not just the USD number. The bigger question is why gold stayed stuck when the US dollar and US Treasury yields started pressing the market again.
- Introduction
- What Happened To Gold On 1 August 2026?
- What Is The Gold Chart Showing?
- Why Did Gold Move This Way?
- What Does This Mean For Malaysian Gold Savers?
- What Practical Action Makes More Sense?
- Conclusion
What Happened To Gold On 1 August 2026?
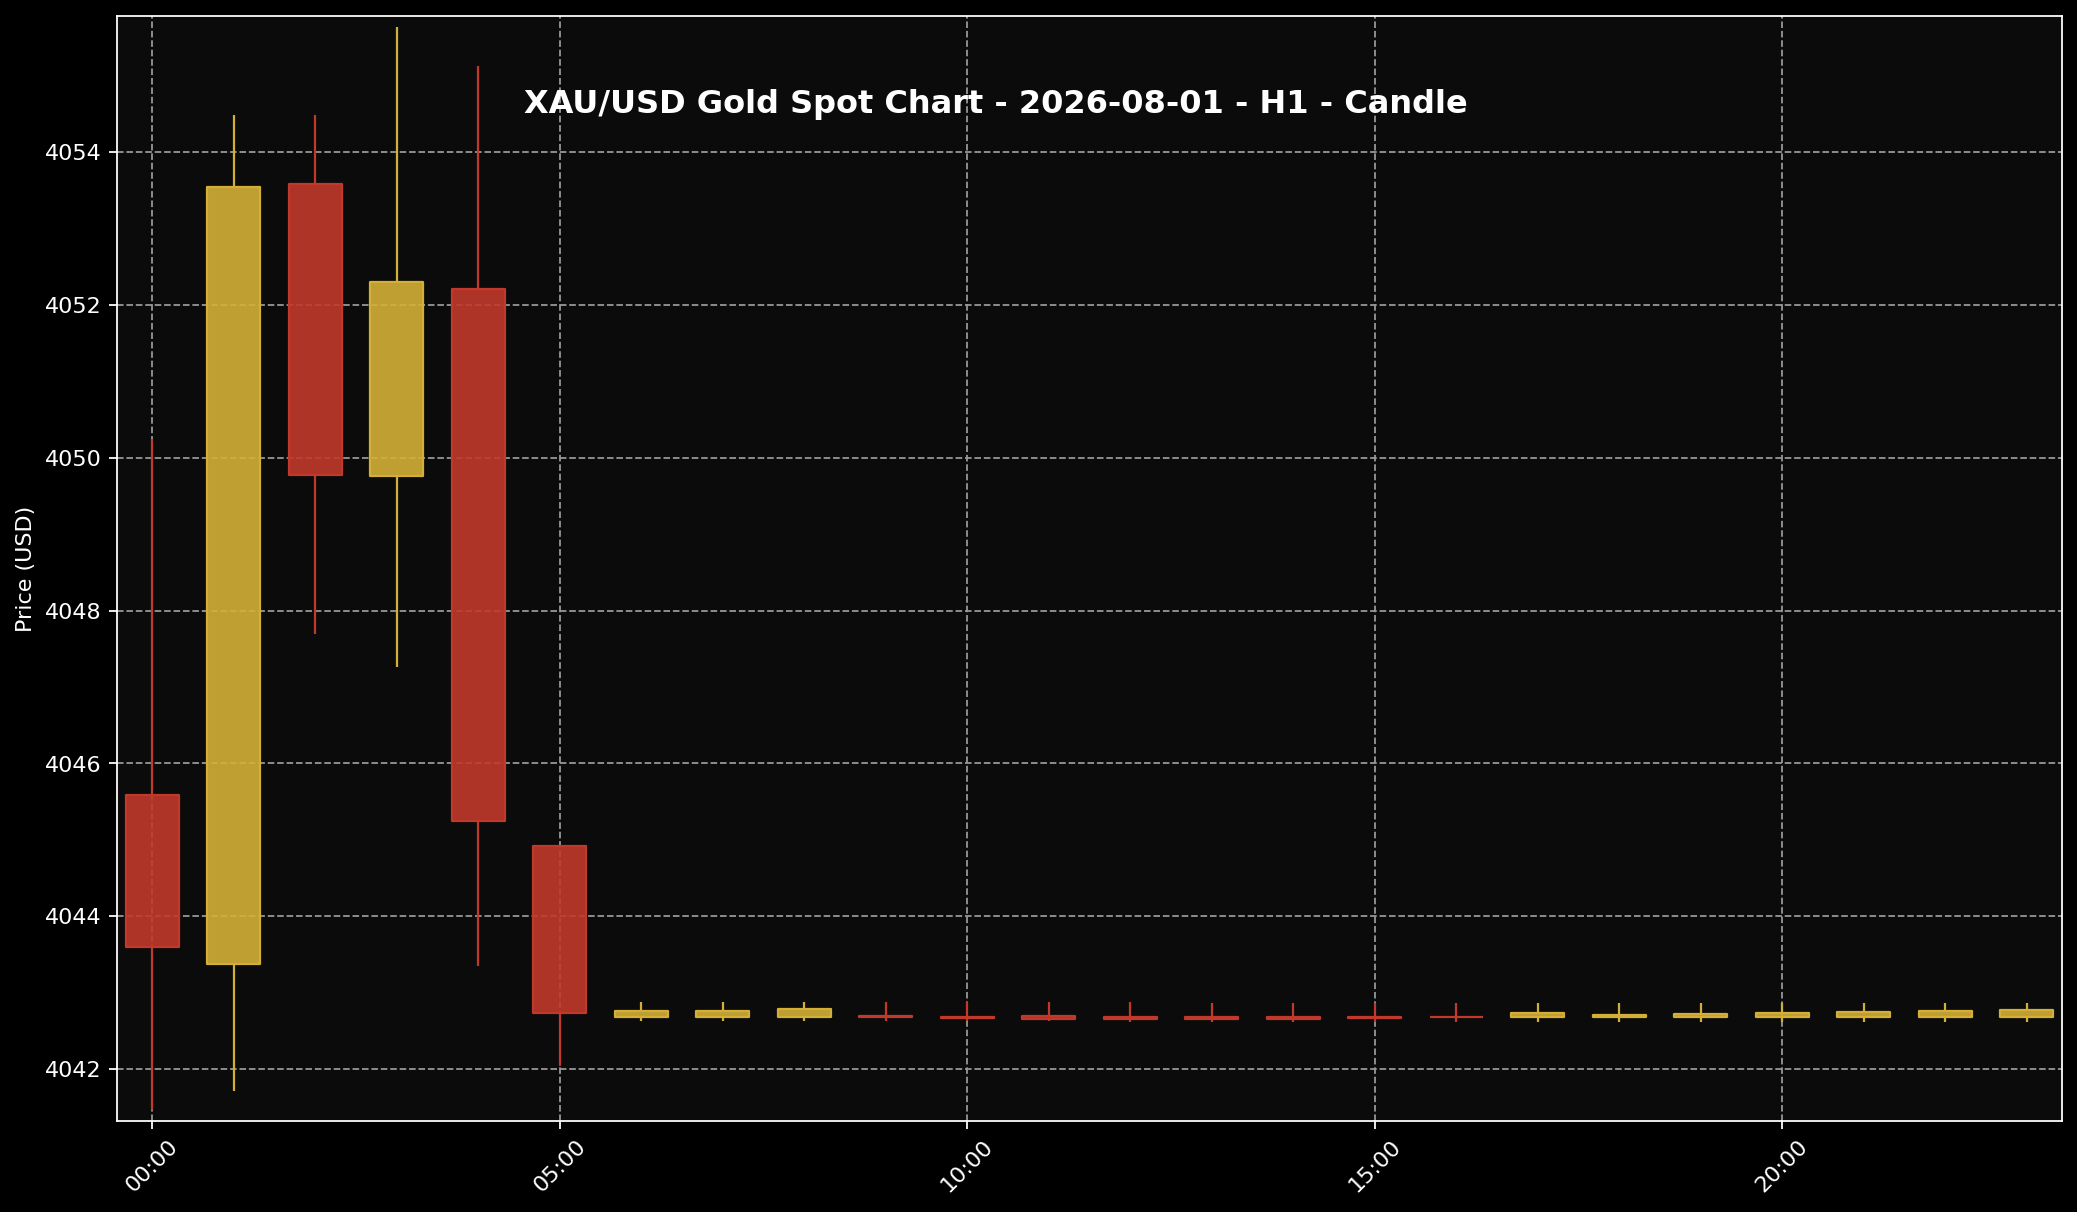 This chart shows the XAU/USD movement for the 1 August 2026 market session. Sifu Gold uses it as a visual reference, not a cue to buy emotionally.
1. On 1 August 2026, the approved global gold reference was around USD4,042.77 per troy ounce, or about USD129.98 per gram. Using USD/MYR around 4.0865, that worked out to roughly RM16,520.69 per troy ounce, or about RM531.15 per gram. These Ringgit figures are global spot gold conversions only. They are not local physical retail prices in Malaysia, and they should not be read as the direct price of any local gold product.
2. The market story was still tied to the last complete trading session before the weekend. Gold tried to hold near the low USD4,000 area, but pressure from the US dollar and US Treasury yields was still there. When the US dollar gets stronger, gold can feel more expensive for buyers outside the United States. When bond yields stay high, some investors may prefer assets that pay regular income.
3. The way I see it for Sifu Gold readers, this was a market that had not fully chosen its next direction. Softer US inflation data had given gold some support earlier, but that support was not strong enough to push gold into a clearer move. So the better reading is this: gold was still stuck, not starting a fresh strong trend.
What Is The Gold Chart Showing?
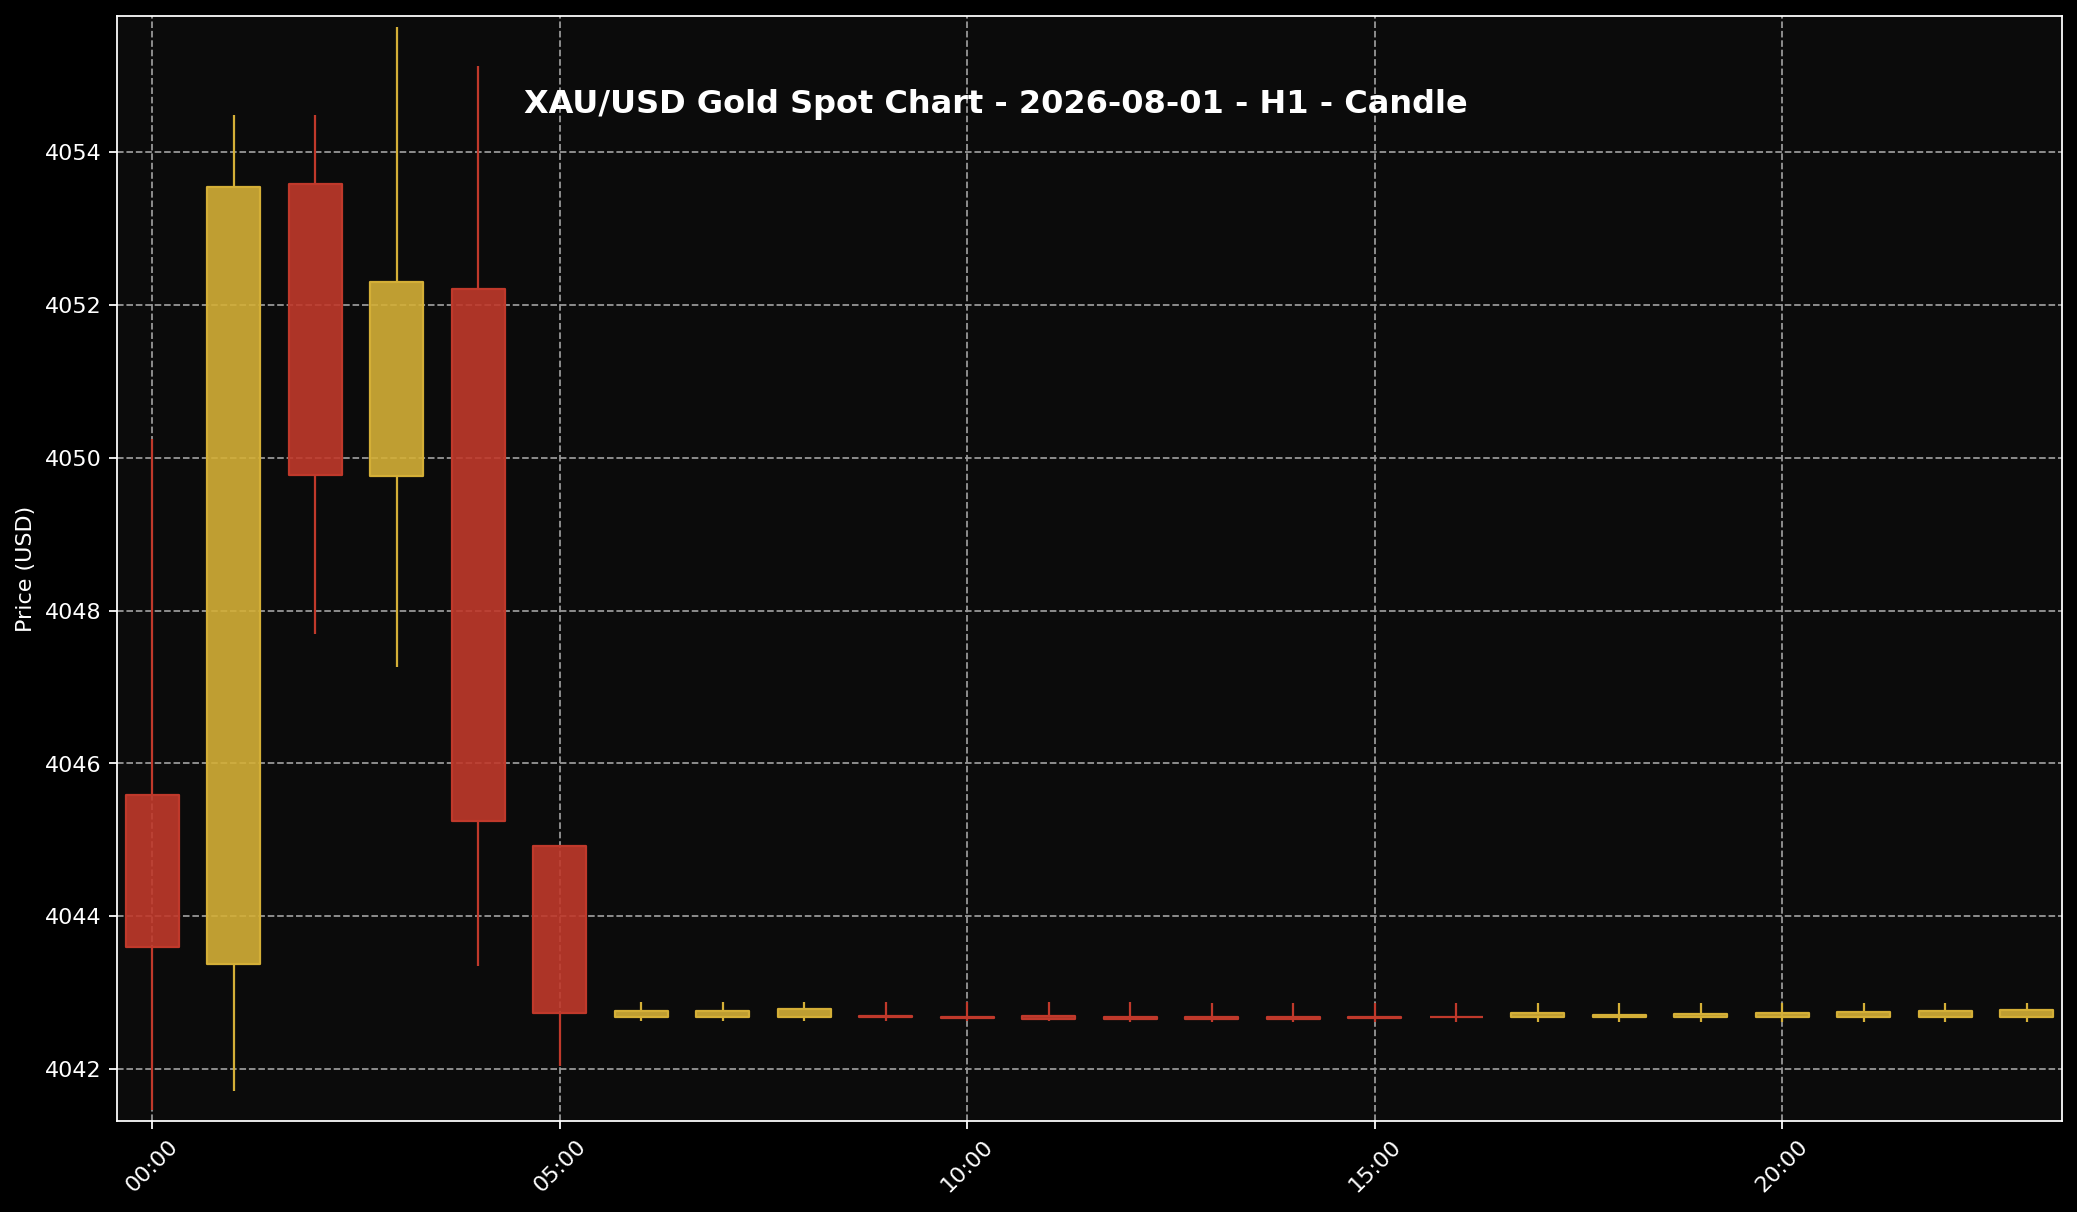 This chart helps readers see the gold price structure for the 1 August 2026 market session. It is used as market context and price-structure reference only.
1. Looking at the H1 chart, the earlier movement looked more active. Gold moved within a wider area around the low USD4,000 zone, with price action seen around roughly USD4,041 to USD4,055. After that, the movement became much tighter. Price settled close to the USD4,042 to USD4,043 area. In simple terms, the market moved from a more active phase into a narrow range.
2. That kind of chart does not give a strong breakout story. It also does not show a big change in direction. The final referenced H1 candle was very small, with the open, high, low and close sitting close together. To me, that looks more like a market waiting for a new reason to move, not a market giving a strong signal to buyers or sellers.
3. So the chart is useful for one thing: it shows that gold was still holding near the low USD4,000 area, but without clear fresh momentum. For gold savers, this is not about finding a trading setup. It is simply a way to understand why the price looked slow after the earlier pressure from the US dollar and yields.
Why Did Gold Move This Way?
 The US dollar is often one of the key factors influencing gold prices. When the dollar is firmer, gold can face more noticeable pressure.
1. The clearest reason came from two things moving against gold: the US dollar and US Treasury yields. Kitco’s market reports pointed to gold retreating as the dollar strengthened, yields stayed elevated, and oil prices added some extra pressure. Reuters-linked body-backed reports also showed gold slipping as the US dollar regained footing, even though gold was still heading for a better monthly performance.
2. Put simply, the market did not treat softer US inflation data as a strong enough reason to keep pushing gold higher. Softer PCE inflation can help gold because it may reduce pressure for interest rates to stay high. But that story was capped when traders came back to the same bigger question: what will the Fed do, and how long will yields stay attractive?
3. When the market thinks US rates may stay higher for longer, US bond yields can remain firm. That makes life harder for gold because gold does not pay interest or dividends. Some investors then compare two choices: hold gold, or hold bonds that are paying a more obvious return. That is where the short-term pressure on gold came from, even while the price was still holding near the USD4,000 area.
What Does This Mean For Malaysian Gold Savers?
 For Malaysian gold savers, the key point is not only whether prices rise or fall. What matters more is budget, discipline and a clear purpose.
1. For Malaysian gold savers, looking at XAU/USD alone is not enough. Gold is priced globally in US dollars, but Malaysians save, spend and plan in Ringgit. So the Ringgit translation matters. At USD4,042.77 per troy ounce and USD/MYR around 4.0865, the global spot reference worked out to about RM531.15 per gram.
2. But there is one important difference. Global spot gold converted into Ringgit is not the same as local physical gold pricing. Physical gold in Malaysia can include currency movement, product premium, buy-sell spread, operating cost, logistics and local pricing structure. That is why a small move in global spot gold may not appear one-to-one in local physical gold prices.
3. For me, the useful lesson from this market move is simple. When the US dollar and US yields are still pressing gold, gold may struggle to move higher even when some inflation data looks supportive. This helps savers avoid reacting to one headline or one candle on the chart. The better question is always: does this move fit my saving plan, my budget and my time horizon?
What Practical Action Makes More Sense?
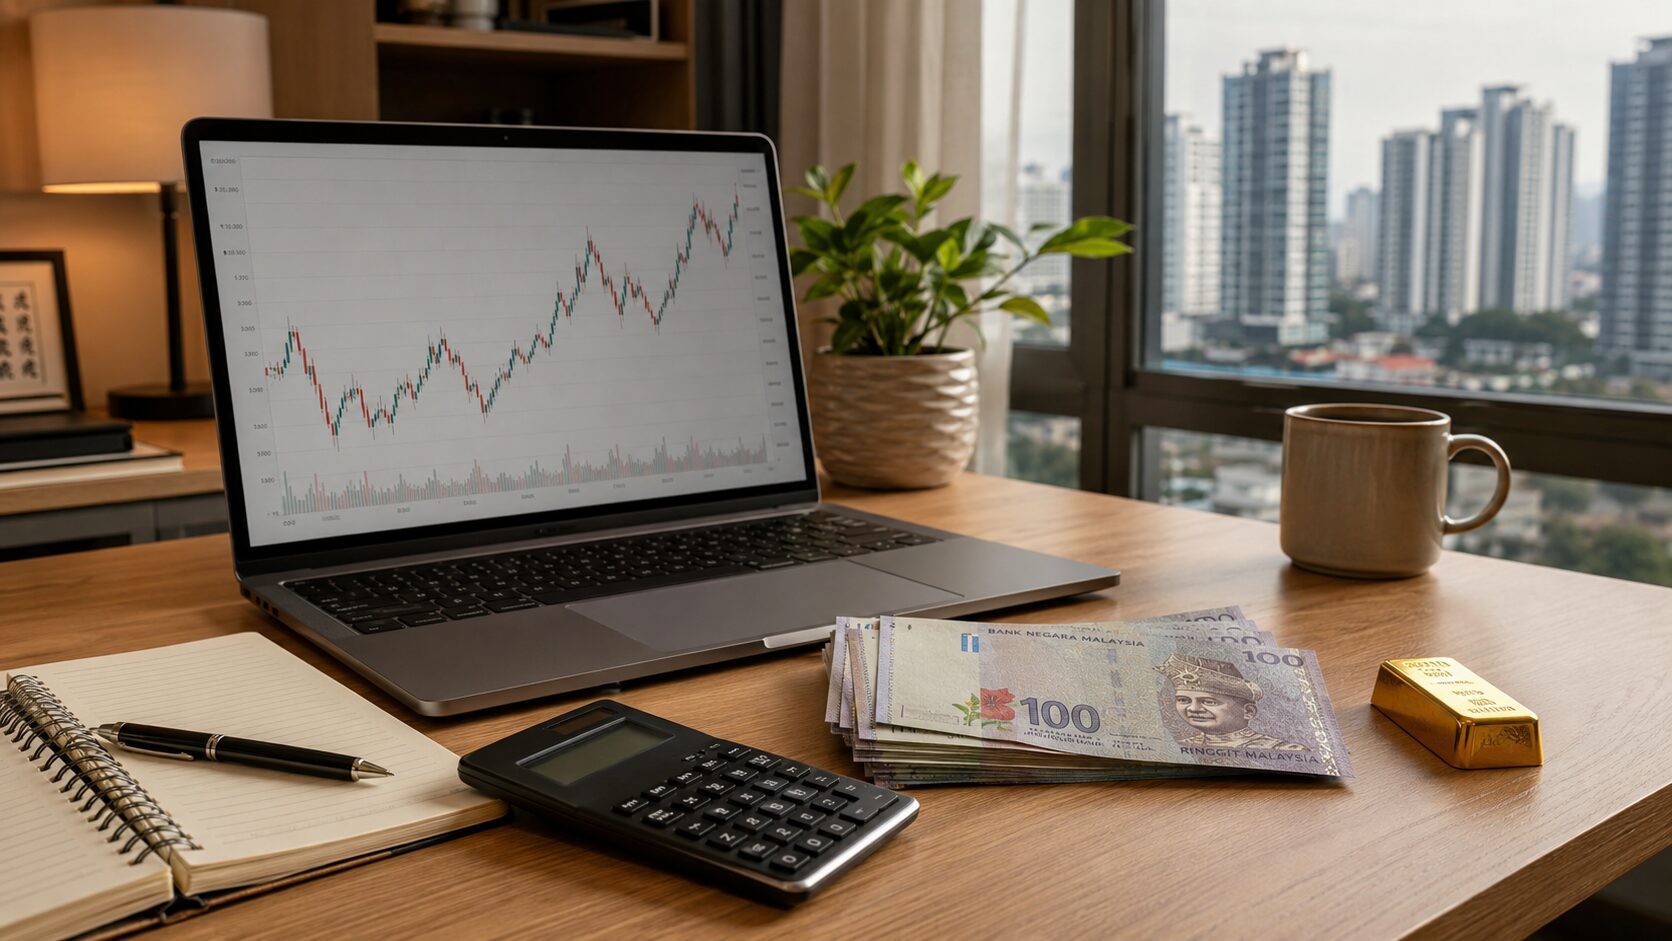 When gold prices move quickly, better decisions usually come from disciplined planning, not panic reactions.
1. If you already have a monthly gold-saving budget, small staged purchases still make more sense than trying to guess the lowest price. When gold is moving in a tight range, there is no need to chase every small movement. Follow the budget you have already set, and make sure the purchase does not disturb your basic commitments.
2. If this month’s budget is tight, there is no need to force it. Waiting while checking your cash flow can also be a disciplined decision. Gold is a long-term saving tool, not a reason to commit the full budget at once. It is usually better to build grams bit by bit than to go in heavily once and later be forced to sell because other commitments are affected.
3. Over the next few days, the things worth watching are the US dollar, US Treasury yields, Fed rate expectations, USD/MYR and local physical gold pricing. If the US dollar stays strong, gold may still find it harder to climb. If pressure from yields starts to ease, gold may get a better chance to breathe. For now, the practical move is to check the budget, understand the spread, and continue the staged saving plan only if it already fits your situation.
Conclusion
The conclusion for 1 August 2026 is quite simple. Gold had not found a strong new direction. The price was around USD4,042.77 per troy ounce, or about RM531.15 per gram based on global spot conversion, but the market story was still controlled by the US dollar, US Treasury yields and Fed rate expectations. For me at Sifu Gold, this is not the kind of market where readers need to rush after the price. If the saving plan is already in place and the budget is comfortable, small staged buying can continue according to personal affordability. If the budget is not ready, check it first. For those who are just starting to build grams, the Gold Accumulation Program by Public Gold allows you to start saving gold from as low as RM100, as long as it suits your budget and saving goals.

