


Gold bounced back on 11 September 2026 after falling in the previous session. Buyers returned at lower prices, even as US inflation data made a Federal Reserve rate rise look more likely. If higher rates usually put pressure on gold, why did it recover? Because prices do not follow just one piece of news. Some buyers saw the earlier fall as a reason to step back in. For those of us saving in gold, though, a rebound is not the same as a lasting change in direction.
- Introduction
- What Happened To Gold On 11 September 2026?
- What Is The Gold Chart Showing?
- Why Did Gold Move This Way?
- What Does This Mean For Gold Savers?
- Conclusion
What Happened To Gold On 11 September 2026?
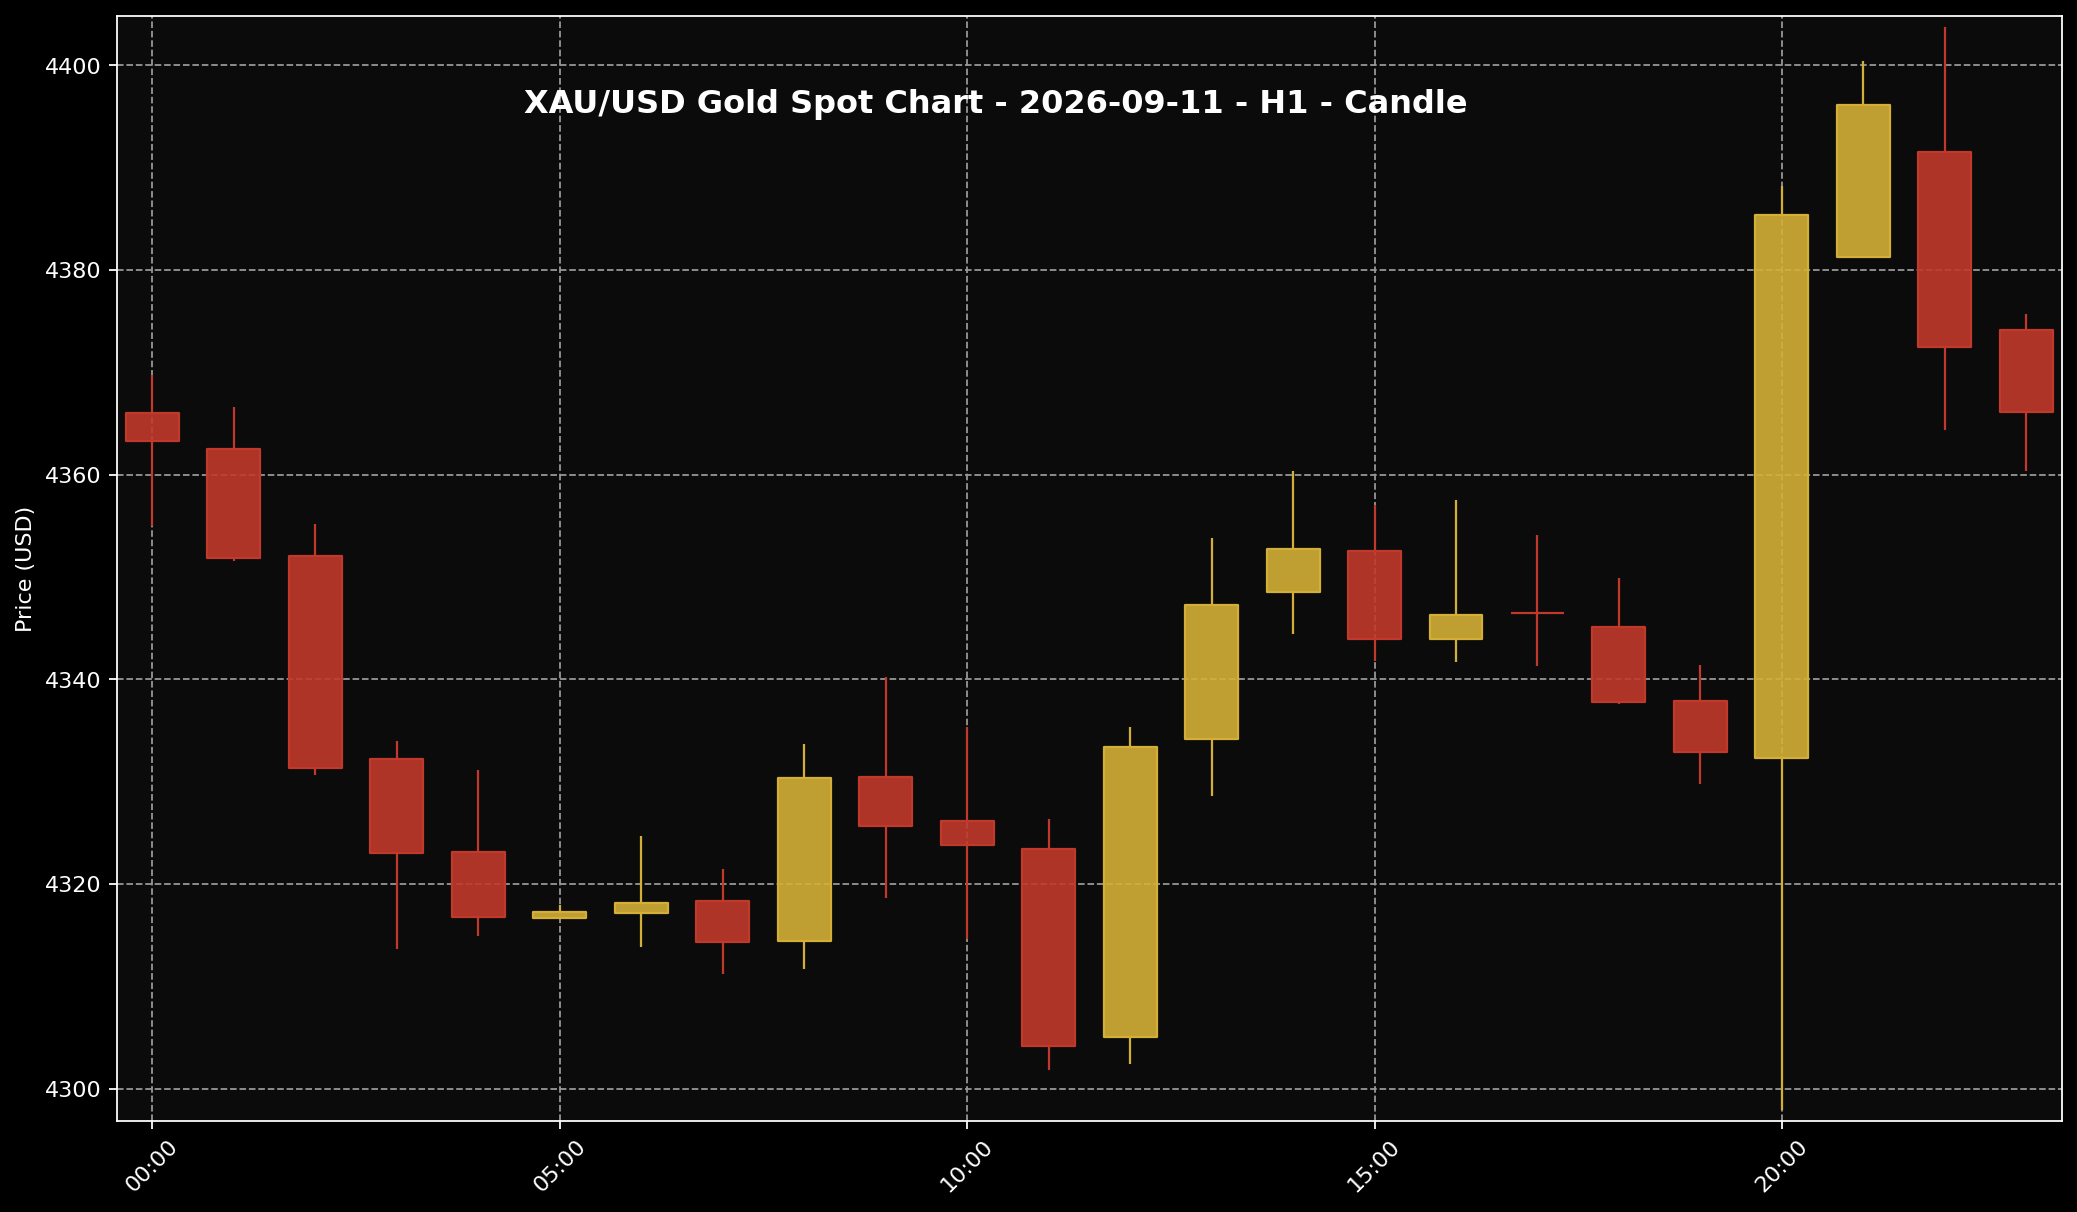 This chart shows the XAU/USD movement for the 11 September 2026 market session. Sifu Gold uses it as a visual reference, not a cue to buy emotionally.
1. Gold recovered as buyers returned after the earlier decline. Twelve Data’s historical reading timestamped 11:00 PM Malaysia time put global spot gold at around USD4,366.13 per troy ounce, or USD140.37 per gram. At USD/MYR 4.07202, that works out to roughly RM17,778.96 per troy ounce, or RM571.61 per gram. The exchange rate means one US dollar was worth RM4.07202. These Ringgit figures are conversions of global spot gold, not Malaysian physical gold retail prices. This was a reading for that timestamp, not the final New York session close.
2. The recovery followed a fall of nearly 2% on Thursday, according to Reuters. At the time of its Friday report, gold had risen again but was still down around 1% for the week. So a stronger day did not mean the earlier losses had all been recovered.
3. I would read this as buyers showing interest again after prices fell. That matters, but it does not mean gold was free of pressure. The US interest-rate question was still there, and the rebound did not move steadily upwards throughout the session.
What Is The Gold Chart Showing?
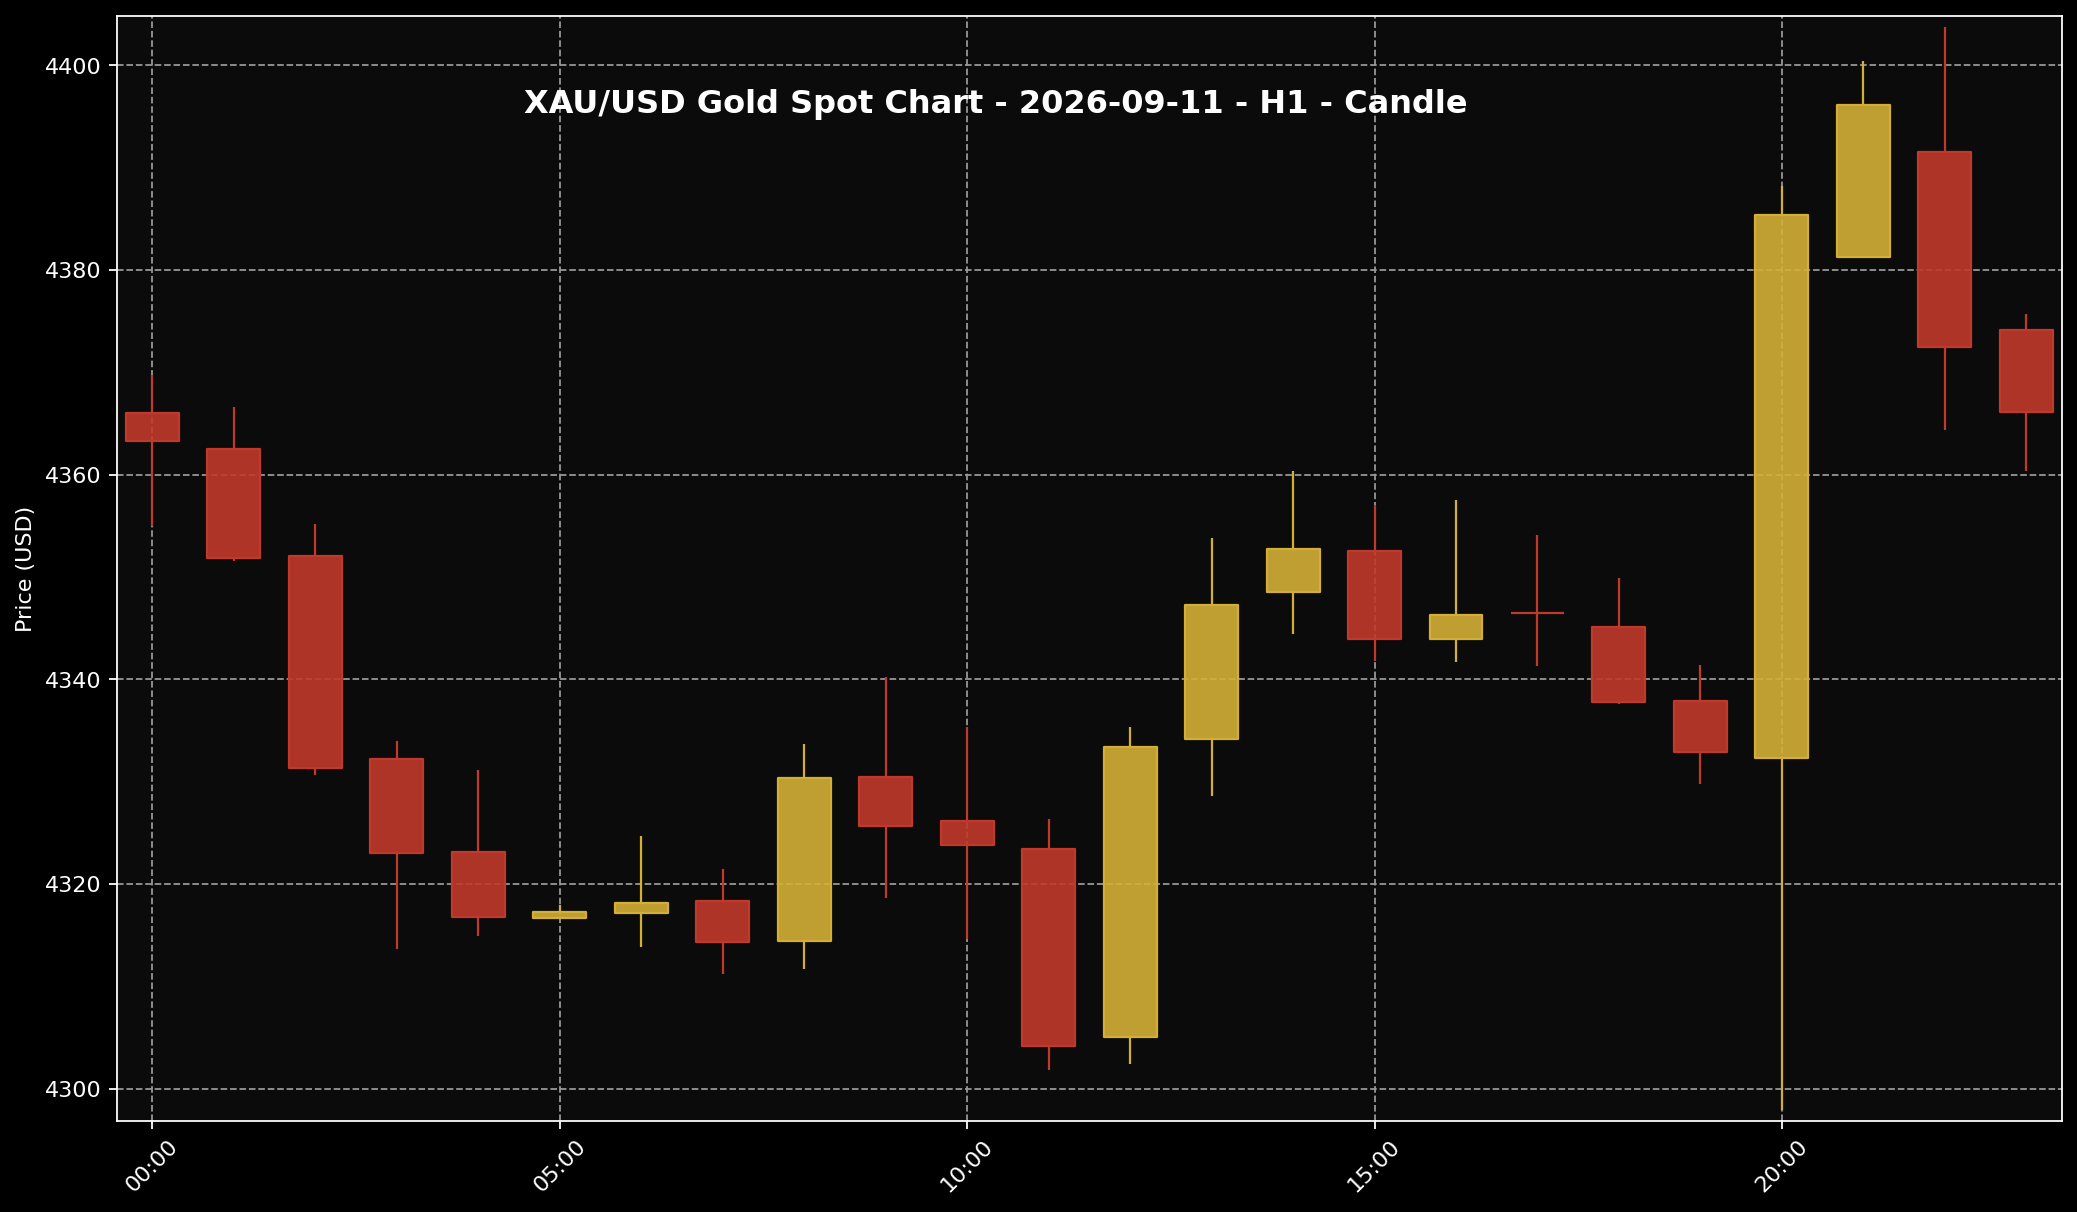 This chart helps readers see the gold price structure for the 11 September 2026 market session. It is used as market context and price-structure reference only.
1. An H1 chart breaks the price movement into one-hour candles. Each candle shows where that hour opened, how high and low the price went, and where it finished. The useful point here is that gold’s recovery still came with pullbacks. Buyers returning after a decline does not mean sellers have disappeared, or that every hour will finish higher.
2. The candle timestamped 11:00 PM Malaysia time finished below its opening price. In plain English, gold gave ground during that hour, even though the wider news story was about a recovery from earlier losses. That helps explain why a rebound can look encouraging without being smooth. A stronger move earlier in the session does not guarantee that the next hour will hold on to it.
3. For me, the useful takeaway is that gold was trying to recover, then giving back some ground along the way. That is not enough to call a lasting change in trend. One hourly candle cannot settle the longer-term picture either. The chart helps explain what happened to the price; the inflation and interest-rate news helps explain why buyers and sellers were still pulling in different directions.
Why Did Gold Move This Way?
 The US dollar is often one of the key factors influencing gold prices. When the dollar is firmer, gold can face more noticeable pressure.
1. US consumer inflation was the main focus. CPI, which tracks changes in the prices consumers pay, rose 0.4% in August after a 0.1% increase in July. Annual inflation stood at 3.4%. This made traders more inclined to expect a rate rise from the Federal Reserve, the US central bank. Reuters, citing CME FedWatch, said the estimated chance rose from 67% before the data to 85%. That was the market’s expectation at the time, not a Fed decision.
2. Why can that put pressure on gold? Gold does not pay interest. When interest rates are higher, interest-paying savings and bonds can look more attractive by comparison. Yet buyers still returned on Friday after the previous fall. That is why gold could recover even when the rate news was not especially helpful. An unfavourable headline does not mean the price must keep falling without a pause.
3. Kitco’s afternoon coverage also pointed to lower oil prices and a softer US dollar helping the recovery. A weaker dollar can make gold cheaper for buyers using other currencies. But one day of lower oil prices does not resolve inflation. Gold had some help to recover; the interest-rate concern had not gone away.
What Does This Mean For Gold Savers?
 For Malaysian gold savers, the key point is to understand the gap between global spot price and local physical price, then act according to budget and discipline.
1. The way I look at it at Sifu Gold, a daily rebound is something to review, not a reason to rush. If you are saving gold for years, your decision is different from someone hoping to sell again soon. For Malaysian savers, USD/MYR also affects how a global price move translates into Ringgit.
2. That RM571.61 per gram is not necessarily what you would pay for physical gold. Local prices also reflect product premiums and the provider’s pricing. Check the spread too: the gap between the price you pay and the price offered when you sell back. A small spot-price rise may not cover that gap.
3. If you already have a gold budget after bills and emergency savings are covered, small purchases spread over time may suit your plan. There is no need to commit the full budget at once because prices have started rising. If money is tight, waiting is reasonable. Ask yourself: am I following my savings plan, or reacting because I am worried gold will rise again?
Conclusion
Gold recovered on 11 September 2026 as buyers returned after the earlier decline. A softer US dollar helped too, but inflation data made a Fed rate rise look more likely. That is why I would not treat this rebound as a sign that all the pressure had passed. If you are building your gold savings, check the local price and your own budget before adding more. Small, regular purchases can make sense when the money is already set aside. If there is no room this month, there is no need to force it. A savings plan you can keep going with is more useful than trying to catch every price rise.

