


What happened to gold on 12 August 2026? Gold moved better after US inflation data did not come in hotter than the market expected. Once that happened, traders started to reduce some of the pressure around another Federal Reserve rate hike. For Malaysian gold savers, the useful point is not just that gold went up. The bigger lesson is how one US inflation reading can affect the Fed story, Treasury yields, global spot gold, and the Ringgit value we see in Malaysia.
- Introduction
- What Happened To Gold On 12 August 2026?
- What Is The Gold Chart Showing?
- Why Did Gold Move This Way?
- What Does This Mean For Malaysian Gold Savers?
- What Practical Action Makes More Sense?
- Conclusion
What Happened To Gold On 12 August 2026?
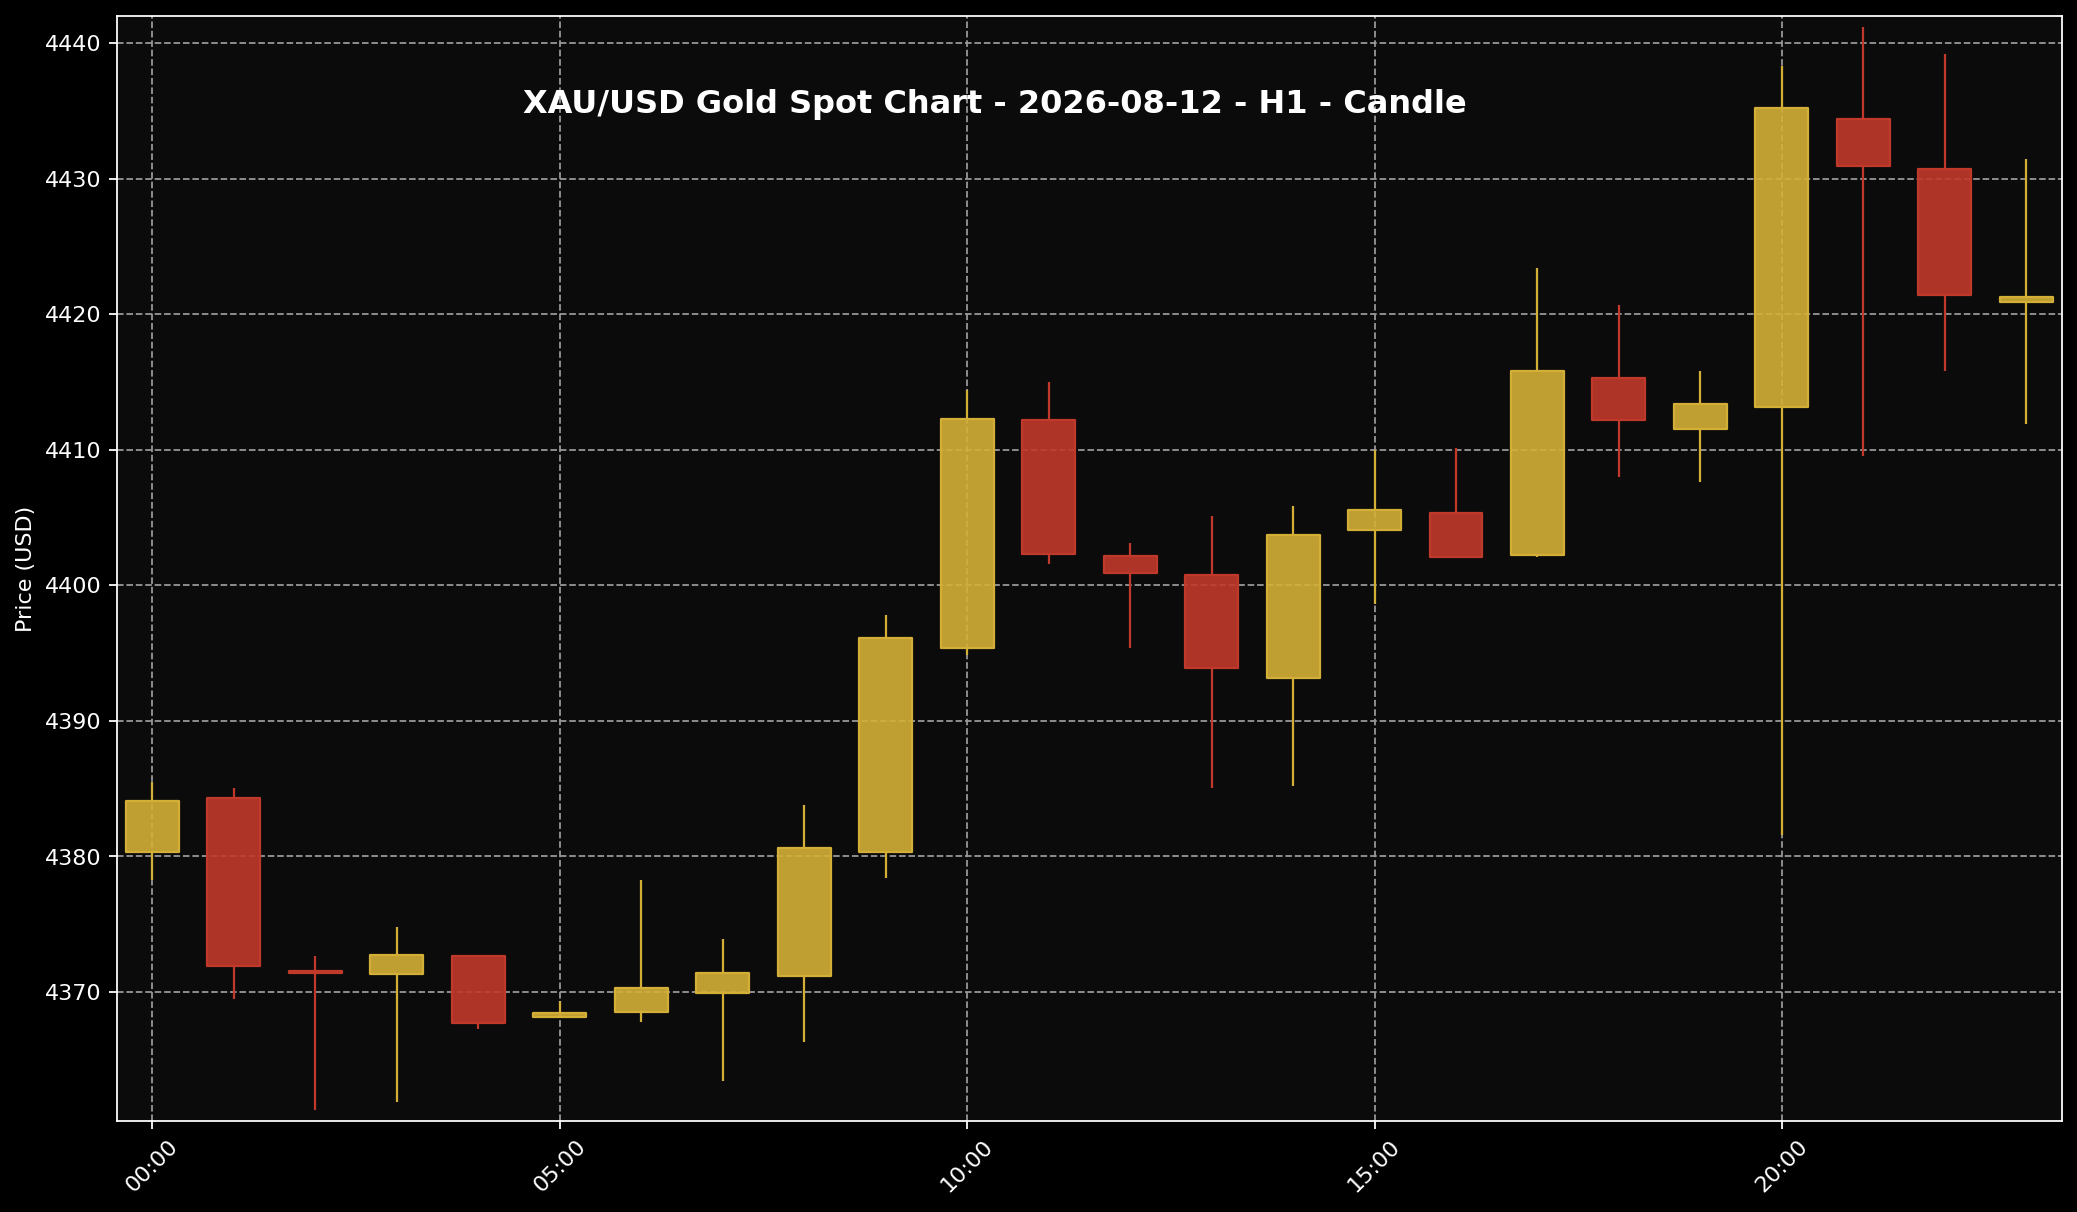 This chart shows the XAU/USD movement for the 12 August 2026 market session. Sifu Gold uses it as a visual reference, not a cue to buy emotionally.
1. At the 11:00 PM Malaysia time snapshot, global spot gold was around USD4,421.24 per troy ounce. If we break that down into grams, it was about USD142.15 per gram. Using the USD/MYR rate of about 4.08542 at the same snapshot time, that worked out to roughly RM18,062.60 per troy ounce, or about RM580.73 per gram.
2. These Ringgit figures are global spot conversions. They are not local physical retail prices in Malaysia. Physical gold prices can look different because they may include premium, buy-sell spread, product type, operating cost, logistics and the local pricing structure. So it is useful to know the spot conversion, but it should not be treated as the exact same thing as the price of a physical gold product.
3. The main story came from US CPI data. CPI is a measure of inflation. When the inflation reading did not bring a fresh shock, the market started to think the Fed may not need to be as aggressive with interest rates. Kitco linked gold’s move higher to the CPI story and easing yield pressure, while Reuters also framed the move around gold rising as US inflation data reduced rate-hike bets.
What Is The Gold Chart Showing?
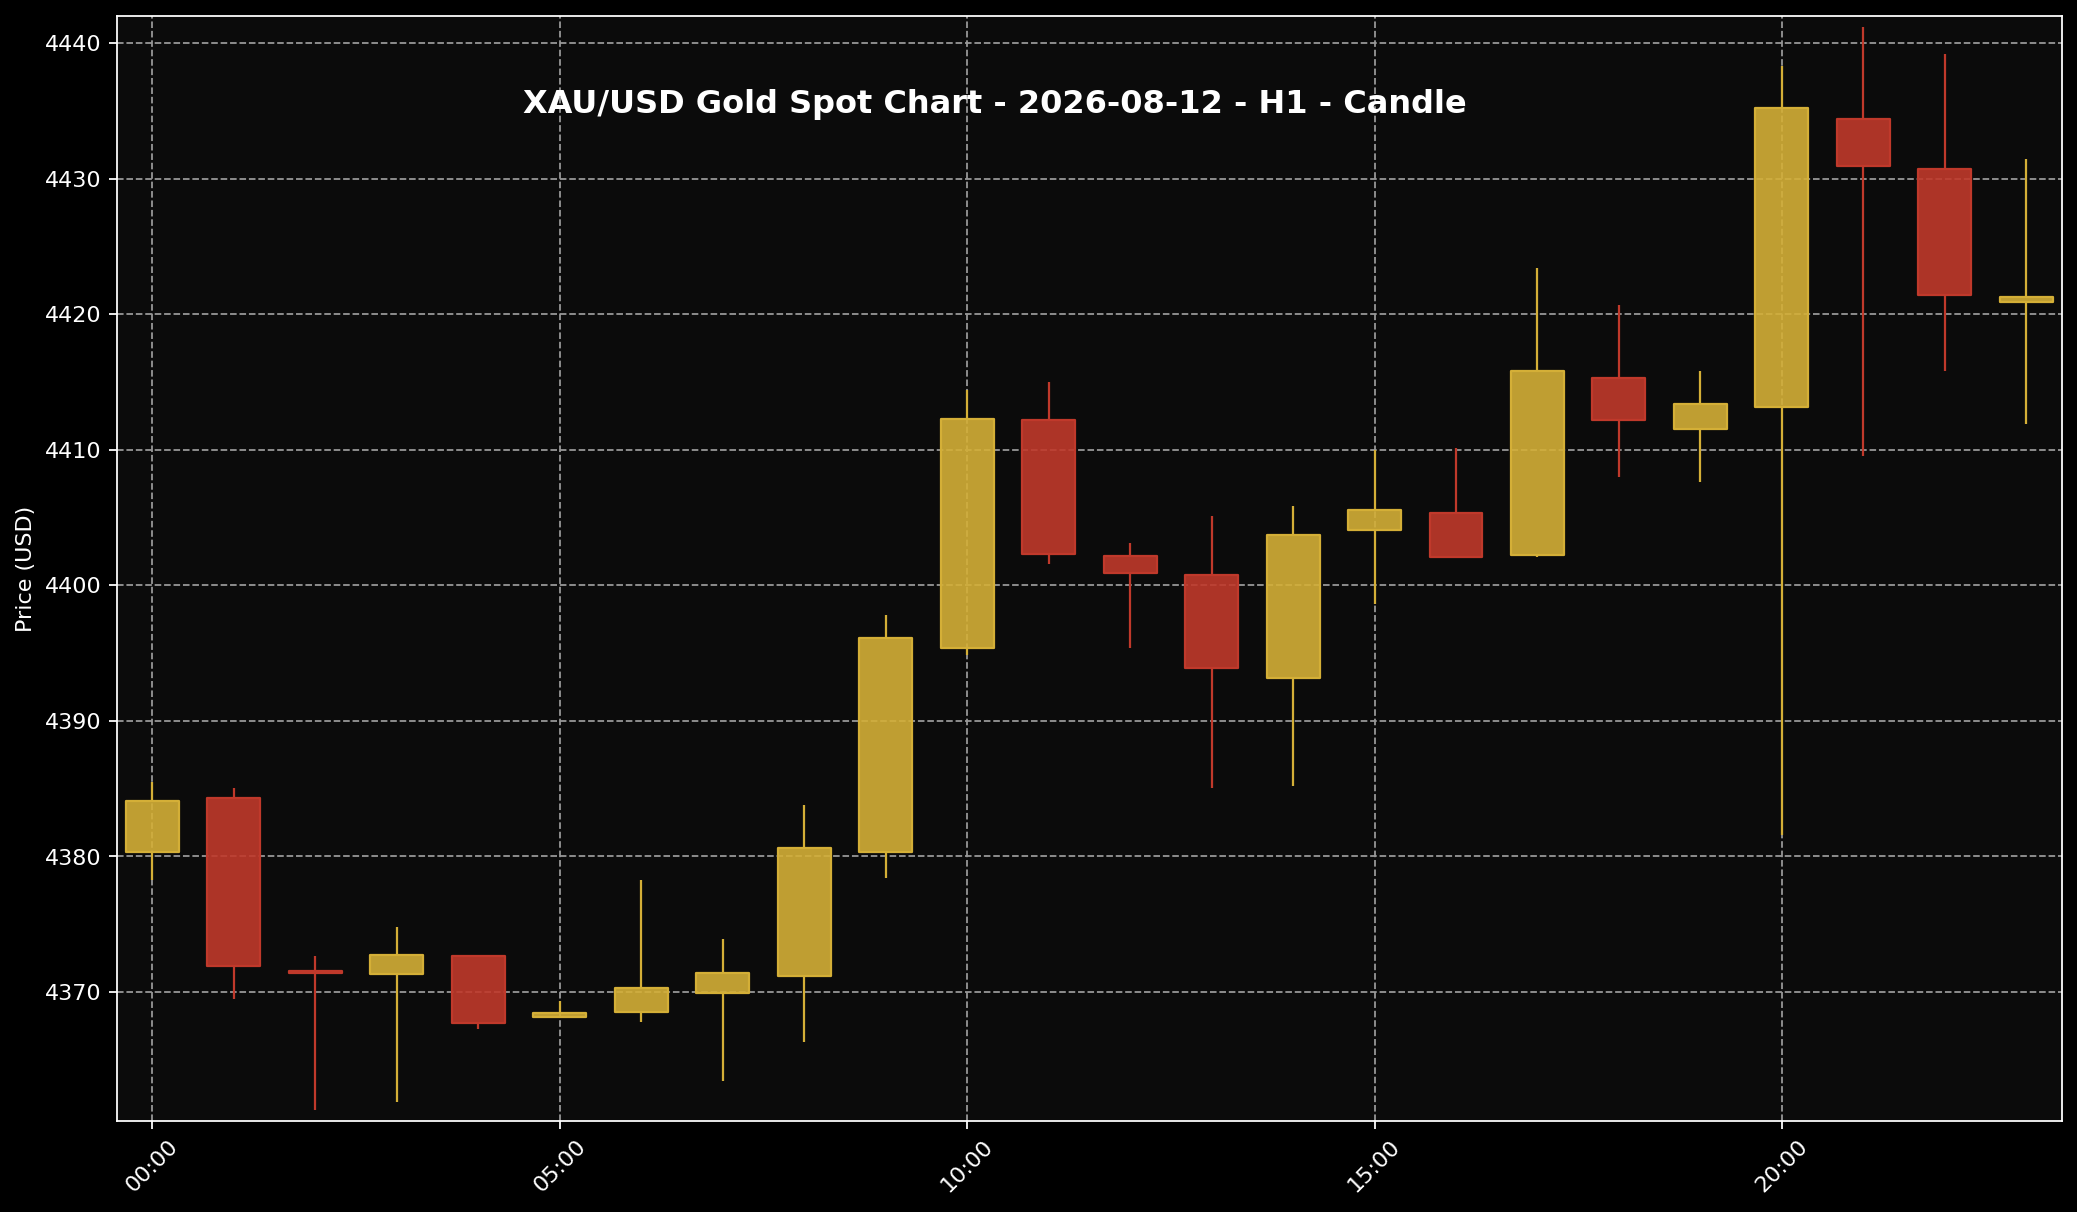 This chart helps readers see the gold price structure for the 12 August 2026 market session. It is used as market context and price-structure reference only.
1. If we look at the XAU/USD H1 chart for 12 August 2026, gold started the day in a fairly tight area around the USD4,370 to USD4,385 zone. After that, the price gradually pushed higher. The clearer part of the move came when gold managed to move above the USD4,400 area and then tested higher levels around USD4,420 to USD4,440.
2. Put simply, the chart did not look flat for the whole session. There was a slower early phase, then the move became stronger as the market digested the US CPI data. Later in the session, some candles showed gold trying to stretch higher, but there were also signs that the move was not completely one-way. That tells us the market was supportive, but still checking how far the move could hold.
3. The better reading is this: gold received support after the inflation news, but the market was still testing whether price could stay around the higher area. This is not something to turn into a trading signal. For gold savers, the main takeaway is simpler. The move was driven more by macro news and rate expectations than by the chart alone.
Why Did Gold Move This Way?
 The US dollar is often one of the key factors influencing gold prices. When the dollar is firmer, gold can face more noticeable pressure.
1. The story is quite simple. When US inflation did not surprise the market on the upside, traders started to think the Federal Reserve might have less pressure to keep raising interest rates. The Fed is the central bank of the United States. Its rate decisions matter because they can affect the US dollar, US Treasury yields and how attractive gold looks to investors.
2. Treasury yields can be understood as the return investors get from US government bonds. When yields rise, gold usually finds it harder to attract money because gold does not pay interest. But when yields ease, that pressure on gold can reduce. That is why the CPI story mattered. It helped reduce some rate-hike concern, and Kitco also pointed to Treasury yields easing after the inflation data.
3. So the chain looked like this: US inflation data came out, the market adjusted its view on the Fed, yield pressure eased, and gold had more room to move higher. But this still needs to be read as a reaction to one important data point. It does not mean gold will move in a straight line after that. The Fed story, the US dollar and yields still matter from here.
What Does This Mean For Malaysian Gold Savers?
 For Malaysian gold savers, the key point is not only whether prices rise or fall. What matters more is budget, discipline and a clear purpose.
1. For Malaysian gold savers, it is not enough to look only at gold in US dollars. We also need to translate the global price into Ringgit. At the 12 August 2026 snapshot, global spot gold around USD142.15 per gram became roughly RM580.73 per gram using USD/MYR at about 4.08542. That gives us a clearer Malaysia-facing picture of the global move.
2. But that global spot number is still not the same as local physical gold pricing. If you buy physical gold, the final price may look different because of premium, spread, product cost and local pricing. This is why global gold can rise or fall, but the price Malaysian buyers see may not move one-for-one with XAU/USD.
3. The way I see it at Sifu Gold, a day like this is useful for learning the connection between US inflation, the Fed, Treasury yields and gold. Once we understand the reason behind the move, we are less likely to chase price just because gold had one strong day. We can read the market in a more organised way: what triggered it, what it did to global spot gold, and how that translated into Ringgit.
What Practical Action Makes More Sense?
 When gold prices move quickly, better decisions usually come from disciplined planning, not panic reactions.
1. If you already have a monthly budget for saving gold, buying gradually still makes more sense than trying to guess the lowest price. When gold rises after important data like CPI, it is better not to chase one candle. Check your budget first. Check your commitments. Then ask whether the purchase really fits your own saving plan.
2. If your budget is tight, there is no need to force it. Gold can be a good long-term saving asset, but household commitments, family needs, emergency cash and monthly cash flow still come first. Do not go in heavily all at once just because the price is moving actively. That kind of decision usually comes more from emotion than from a proper plan.
3. If you are still deciding, watch a few things first: the US dollar, US Treasury yields, the Fed rate story, USD/MYR and the difference between global spot gold and local physical gold prices. For gold savers, the goal is not to win every daily move. The healthier goal is to build grams according to ability, understand the spread, and stay consistent with your own plan.
Conclusion
For 12 August 2026, gold moved higher because the market read US inflation data as a reason to reduce some pressure around Fed rate hikes. When rate expectations became less aggressive, US Treasury yields eased, and gold had more room to move. That is why global spot gold was around USD4,421.24 per troy ounce, or about RM580.73 per gram when translated into Ringgit at the same snapshot. For me at Sifu Gold, the better question is not only “did gold go up or down?” The better question is “why did it move, and does my buying decision fit my budget?” If you already have a gold-saving plan, small staged buying can be considered according to your own ability. For those who are just starting, the Gold Accumulation Program by Public Gold allows you to begin saving gold from as low as RM100, which can help you build grams gradually without disturbing your main commitments.

