


Gold bounced back on Friday after earlier losses. Does that mean the pressure is over? Not quite. For 12 September 2026, the main global gold market is closed for the weekend, so we are looking back at the last completed session on 11 September, not a fresh Saturday move. Buyers returned after the fall, while US inflation data kept the possibility of higher interest rates in focus. If you are thinking about adding to your gold savings, that is the story worth understanding before reacting to the price alone.
- Introduction
- What Happened To Gold On 12 September 2026?
- What Is The Gold Chart Showing?
- Why Did Gold Move This Way?
- What Does This Mean For Gold Savers?
- Conclusion
What Happened To Gold On 12 September 2026?
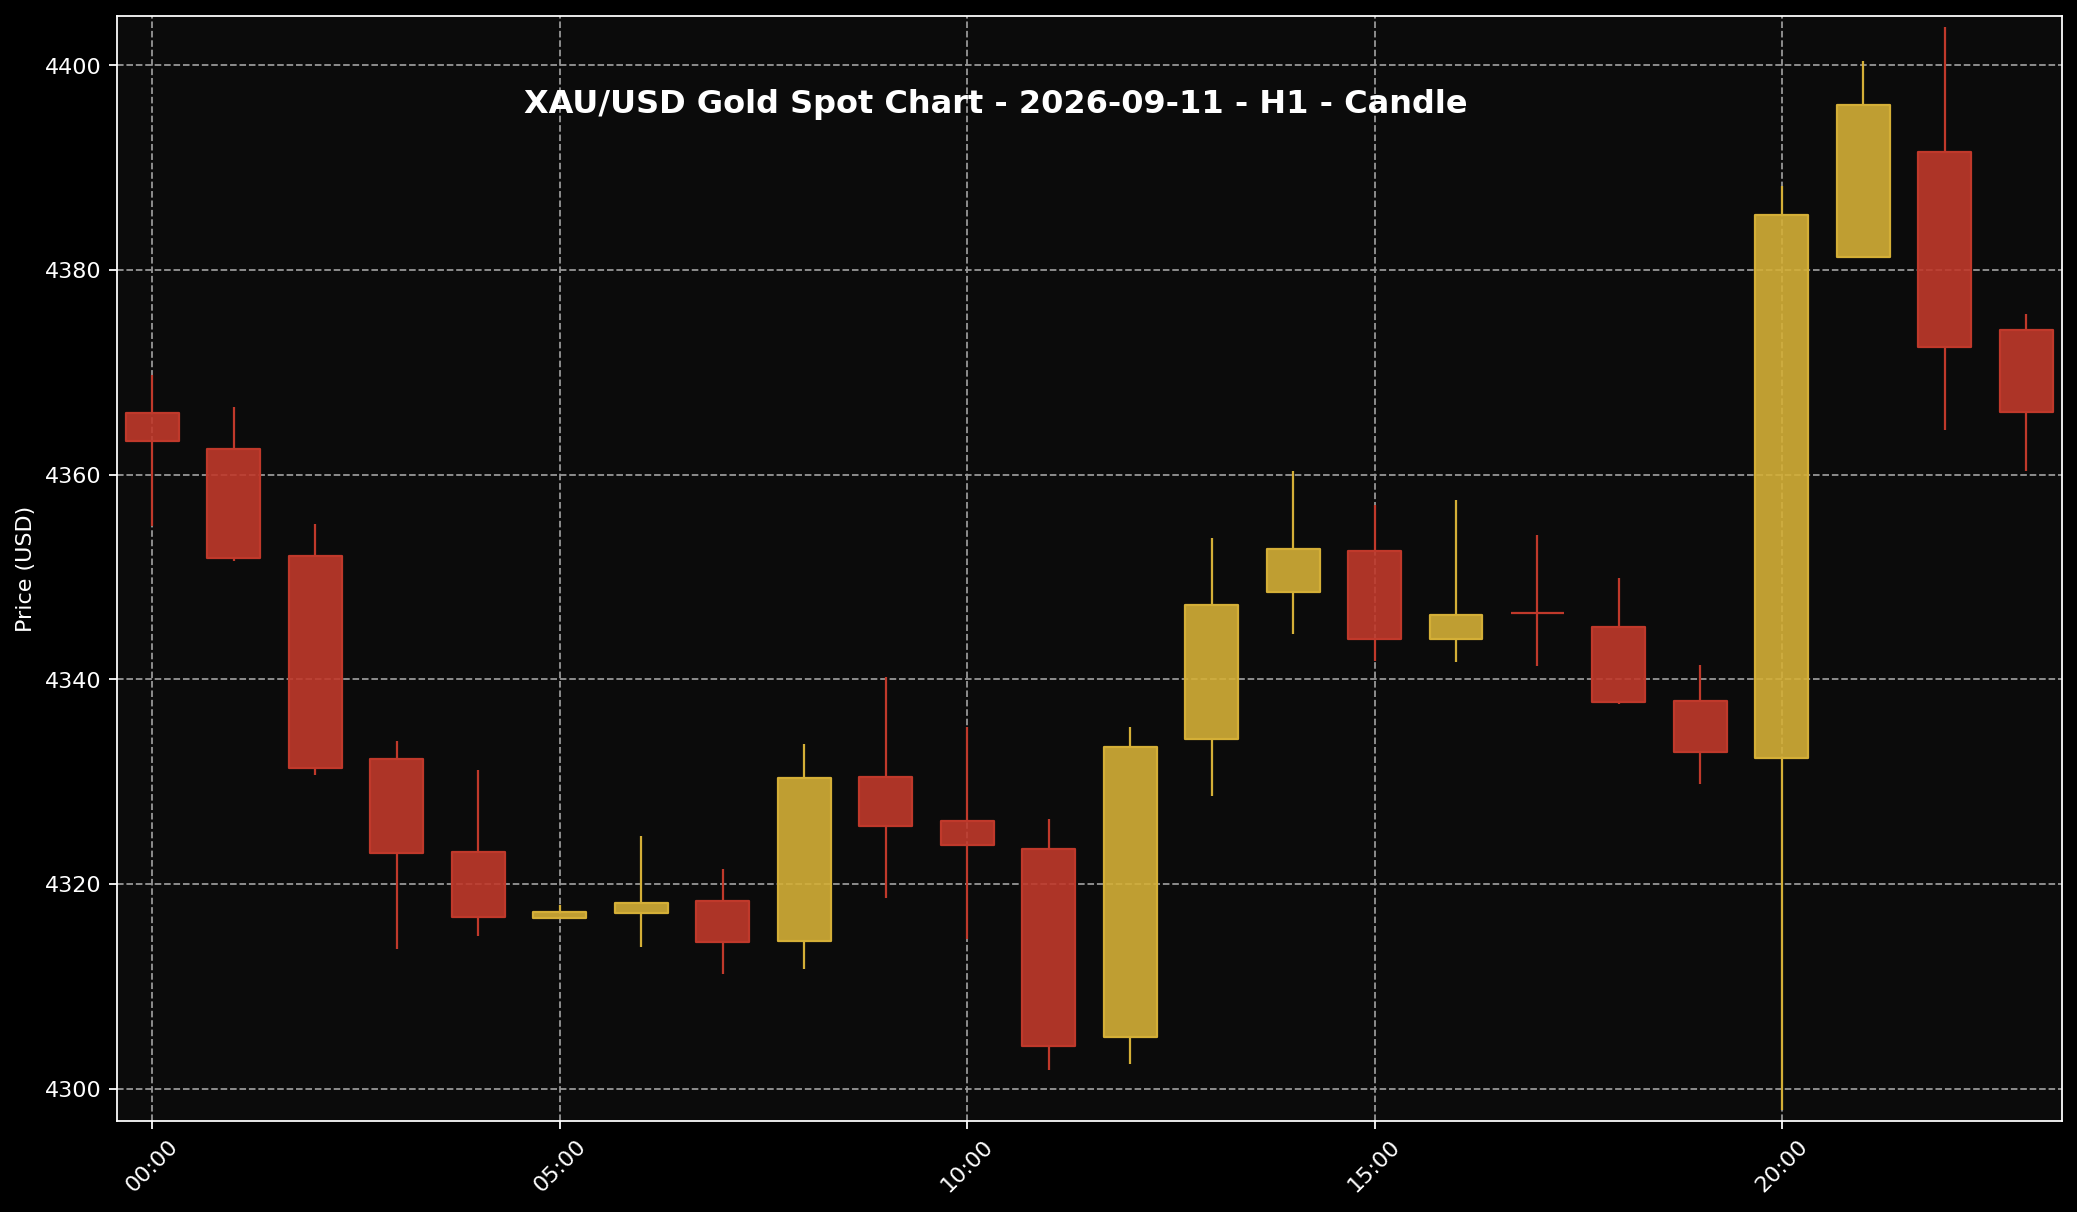 This chart shows the XAU/USD movement for the 11 September 2026 (historical reference; weekend market closed) market session. Sifu Gold uses it as a visual reference, not a cue to buy emotionally.
1. Saturday, 12 September, is a weekend look back rather than a new trading session. Friday’s story was a recovery as buyers returned after the earlier decline. That happened even as expectations of higher US interest rates increased. So a price sitting still while the market is closed does not mean the concerns have disappeared. It simply gives us no fresh trading direction.
2. The Twelve Data historical reference for 11 September 2026 at 11:00 PM Malaysia time puts global gold at USD4,366.12696 per troy ounce, or USD140.3742 per gram. With USD/MYR at 4.07202, meaning one US dollar was worth RM4.07202, the corresponding values are RM17,778.9563 per troy ounce and RM571.6067 per gram. These Ringgit figures are conversions of global spot gold, not physical gold retail prices in Malaysia.
3. The timing matters here. This is a historical Friday-night reference, not a live quote or the official New York closing price. It helps us put the Friday story into Ringgit terms. It is not a new Saturday price, nor a price you can necessarily get when buying physical gold.
What Is The Gold Chart Showing?
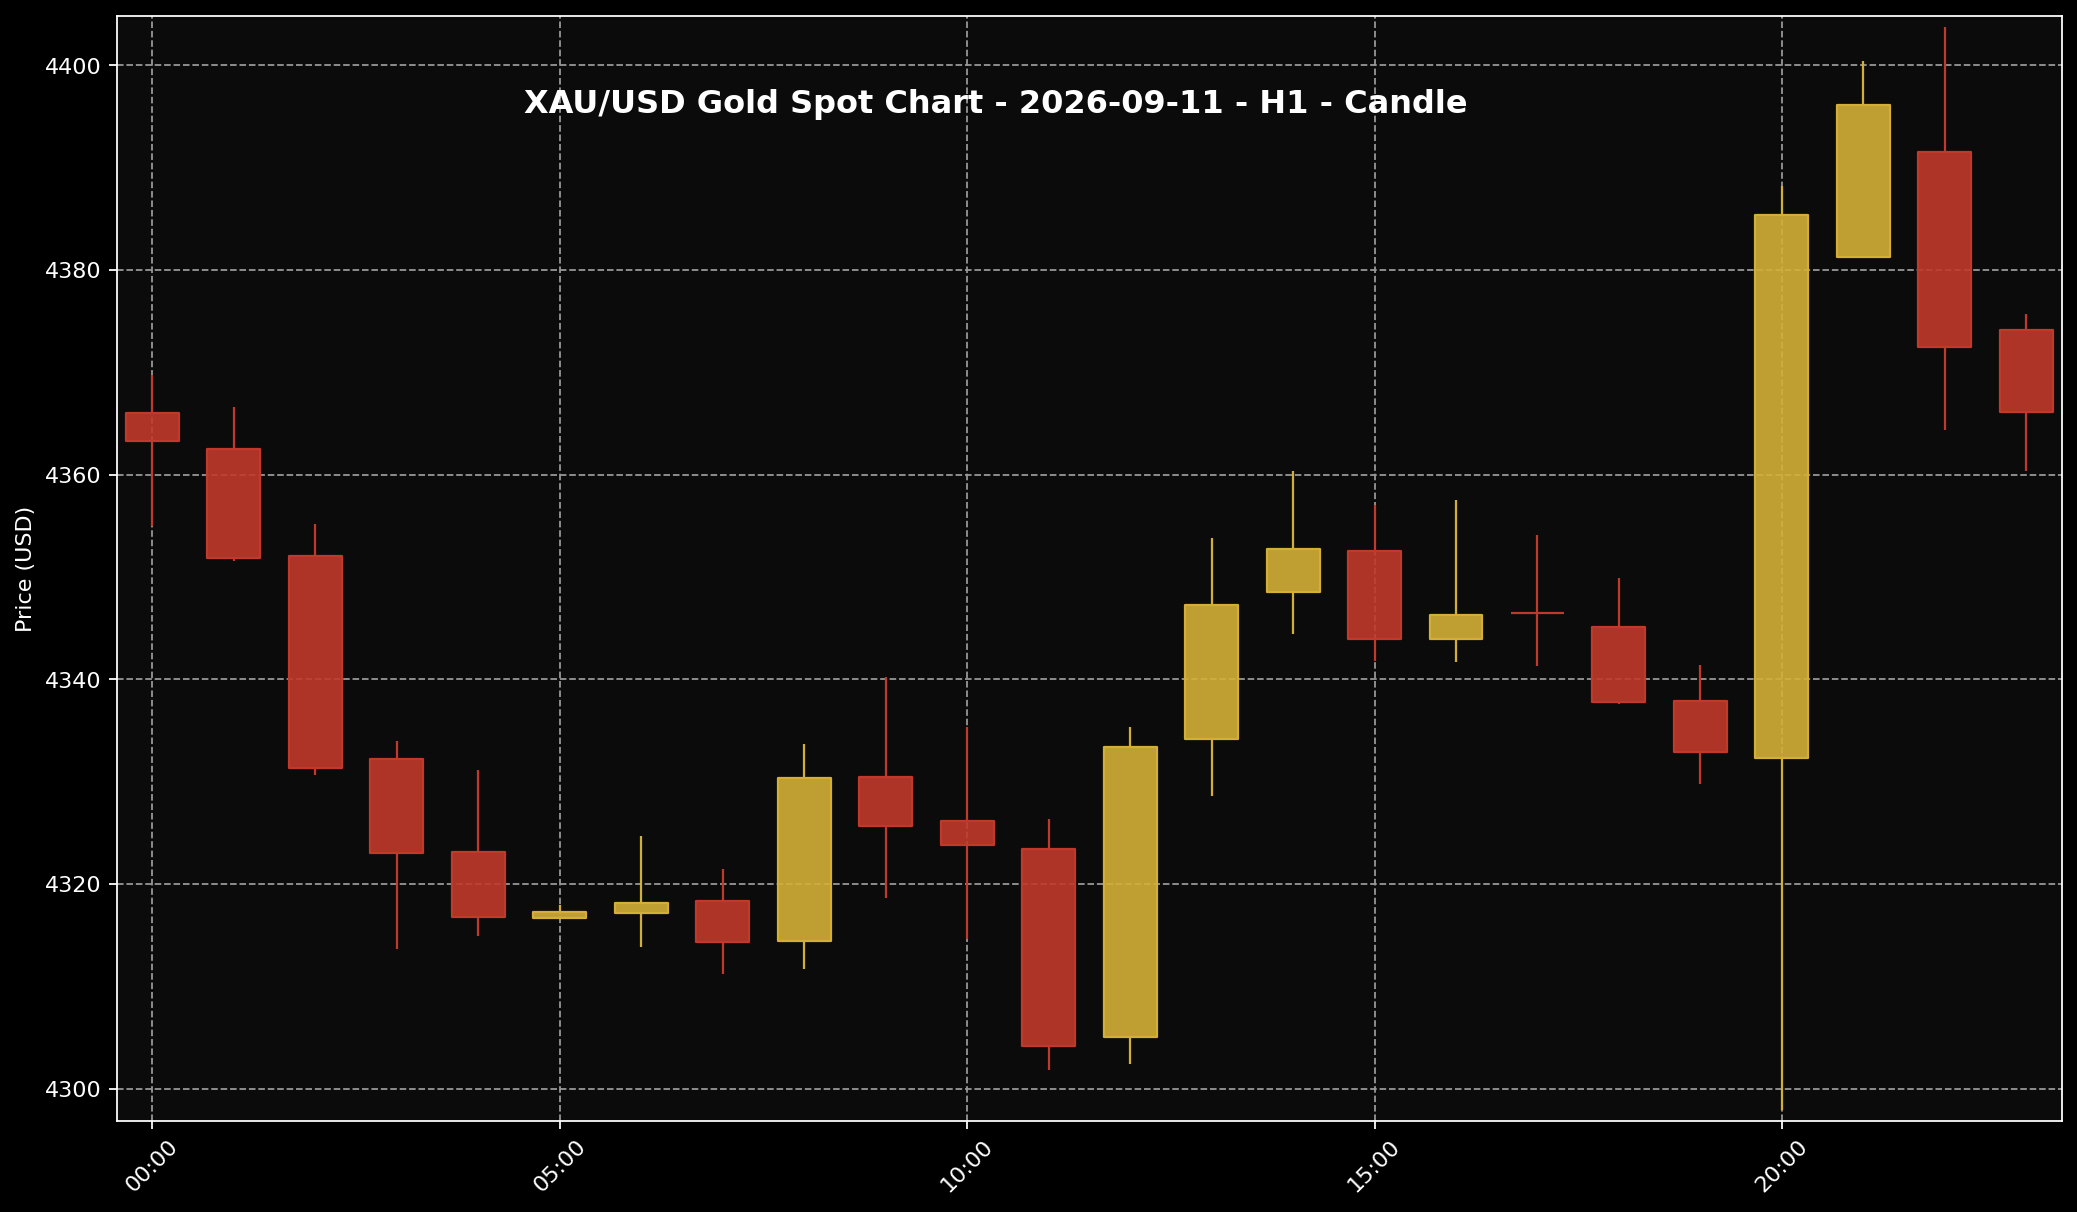 This chart helps readers see the gold price structure for the 11 September 2026 (historical reference; weekend market closed) market session. It is used as market context and price-structure reference only.
1. The hourly chart reference belongs to Friday, 11 September. Each candle represents one hour of price movement, rather than the whole trading day. That distinction helps explain why a recovery can still include periods when the price slips back. Gold does not have to rise in every hour for buyers to have returned after an earlier fall.
2. In the candle marked 11:00 PM Malaysia time, gold opened at USD4,374.14094 and ended at USD4,366.12696. It finished below where that particular candle began. In simple terms, prices slipped during that hour. That fits a recovery which was still uneven, but it does not mean the whole Friday session closed lower. One candle and a full session tell us different things.
3. My reading is that Friday’s rebound deserves attention without being treated as proof of a lasting upward trend. The news explains why buyers returned; the hourly reference reminds us that the recovery still had setbacks. These are observations about Friday, not suggested buying or selling levels. They also cannot tell us how gold will behave when the market reopens. A closed weekend is a pause in trading, not confirmation that the next move will be higher.
Why Did Gold Move This Way?
 The US dollar is often one of the key factors influencing gold prices. When the dollar is firmer, gold can face more noticeable pressure.
1. The clearest reason for Friday’s rebound was buyers coming back after the fall. Reuters’ report on 11 September described gold recovering from earlier losses even as inflation data increased expectations of a Fed rate rise. Some buyers found the lower prices attractive. That can help gold recover without meaning every concern has been resolved.
2. The concern that remained was inflation: rising prices for goods and services. Reuters reported that the US Consumer Price Index rose 0.4% in August, after 0.1% in July. That left traders expecting a greater chance of another rate rise from the Federal Reserve, the US central bank. Why does gold care? It pays no interest. When savings or bonds offer more attractive interest income, some investors may prefer those instead. But a market expectation is not a Fed decision already made.
3. Later on Friday, Kitco also pointed to a weaker US dollar and lower oil prices helping gold recover. A weaker dollar can make dollar-priced gold less expensive for buyers using other currencies. Gold had some help, then, while the rate concern remained. That is the Friday story carried into the weekend, not a fresh Saturday reaction.
What Does This Mean For Gold Savers?
 For Malaysian gold savers, the key point is to understand the gap between global spot price and local physical price, then act according to budget and discipline.
1. My view at Sifu Gold is that daily price moves are something to review, not something that must change your savings plan. Friday’s recovery does not settle next week’s direction. If you are saving gold for years, one rising session need not change your monthly approach. The Ringgit exchange rate also affects how global moves feel locally.
2. The Ringgit spot value is not the physical gold price you pay. Local prices also reflect product premiums and the provider’s pricing. Check the spread too: the gap between your buying price and the price offered when you sell back. That matters especially if you may need to sell again soon.
3. Add now or wait? Start with two questions: is this spare money, and does the purchase fit your budget? Smaller purchases over time can make sense if the money is already set aside. There is no need to commit the full budget at once. If family needs or emergency savings would be affected, waiting makes sense.
Conclusion
For 12 September 2026, the gold story still comes from Friday’s recovery. Buyers returned after the decline, but inflation data kept the possibility of higher Fed rates in focus. The weekend closure gives us no new answer about where gold goes next. I would use this pause to check the budget and compare a provider’s buying and selling prices, rather than chase a rebound that has already happened. If you want to start small, Gold Accumulation Program by Public Gold allows gold savings from RM100. Choose an amount that fits your circumstances. Building your grams gradually is a more useful habit than trying to guess the single lowest price.

