


What happened to gold on 13 August 2026? Gold tried to extend its earlier strength, but the move did not last. The main story came from US producer inflation data. On one side, Treasury yields eased, and that would normally help gold. But on the other side, gold had already climbed for several days and touched a two-month high. So some traders took money off the table. For Malaysian gold savers, the useful question is not just why gold fell, but what that price looks like once we translate it into Ringgit.
- Introduction
- What Happened To Gold On 13 August 2026?
- What Is The Gold Chart Showing?
- Why Did Gold Move This Way?
- What Does This Mean For Malaysian Gold Savers?
- What Practical Action Makes More Sense?
- Conclusion
What Happened To Gold On 13 August 2026?
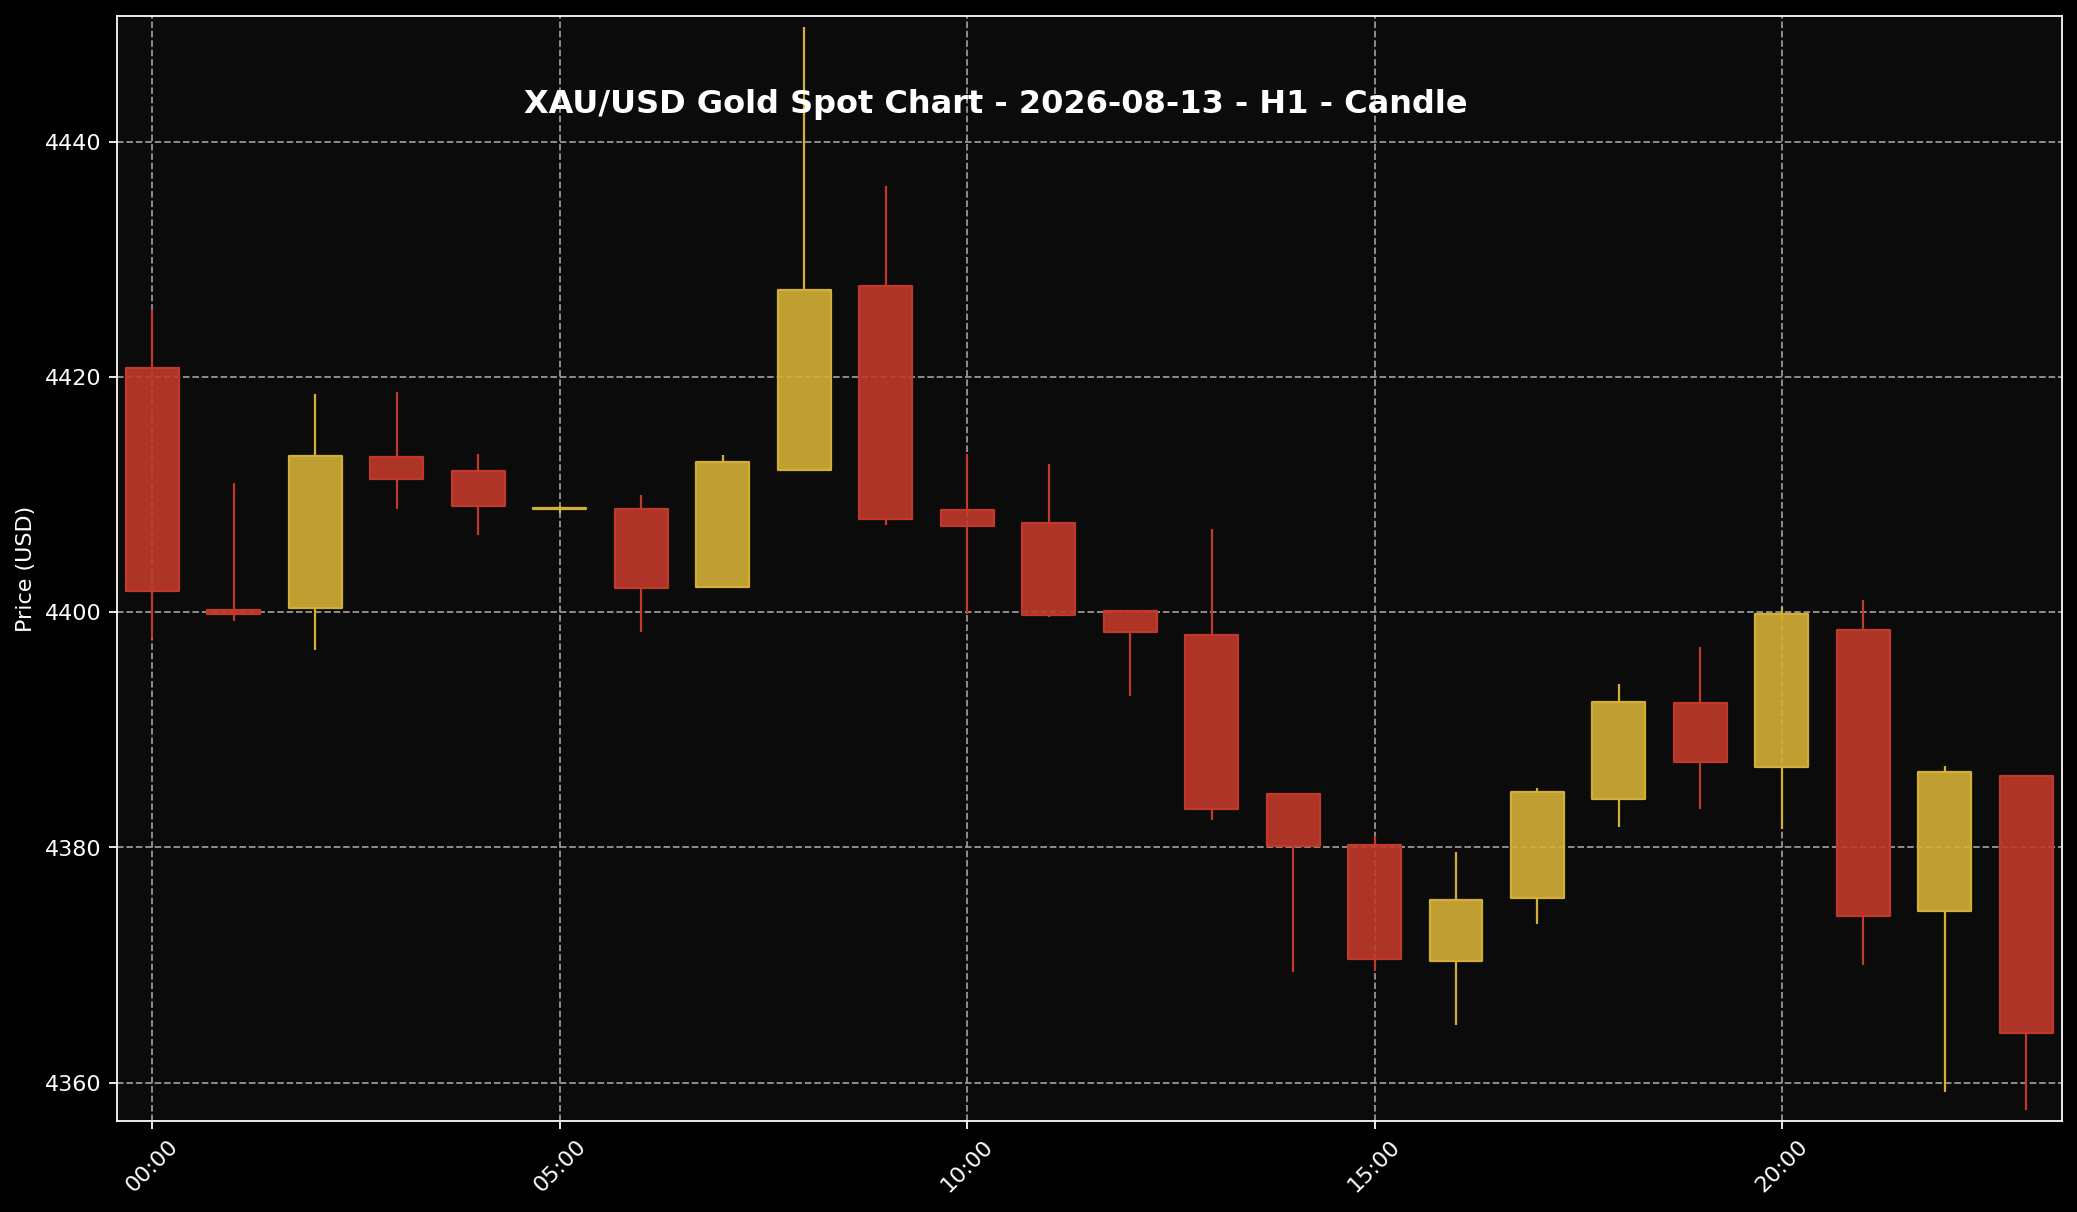 This chart shows the XAU/USD movement for the 13 August 2026 market session. Sifu Gold uses it as a visual reference, not a cue to buy emotionally.
1. On 13 August 2026, the approved market snapshot placed global spot gold around USD4,364.18 per troy ounce at 11:00 PM Malaysia time. If we break that down into grams, it was around USD140.31 per gram. This gives us the global price reference first, before we bring it back to the Malaysian side.
2. Using the same snapshot, USD/MYR was around 4.08648. That means the global spot gold reference was roughly RM17,834.13 per troy ounce, or about RM573.38 per gram. This Ringgit figure is only a global spot conversion. It is not the same as local physical retail gold pricing in Malaysia, and it is not the same as Public Gold GAP 24K pricing.
3. The market story was quite simple. Gold had already moved up for several sessions and reached a two-month high. Then US inflation data came in and traders reassessed the move. Some chose to lock in earlier gains. That is why gold slipped, even though easing Treasury yields would usually reduce some pressure on gold.
What Is The Gold Chart Showing?
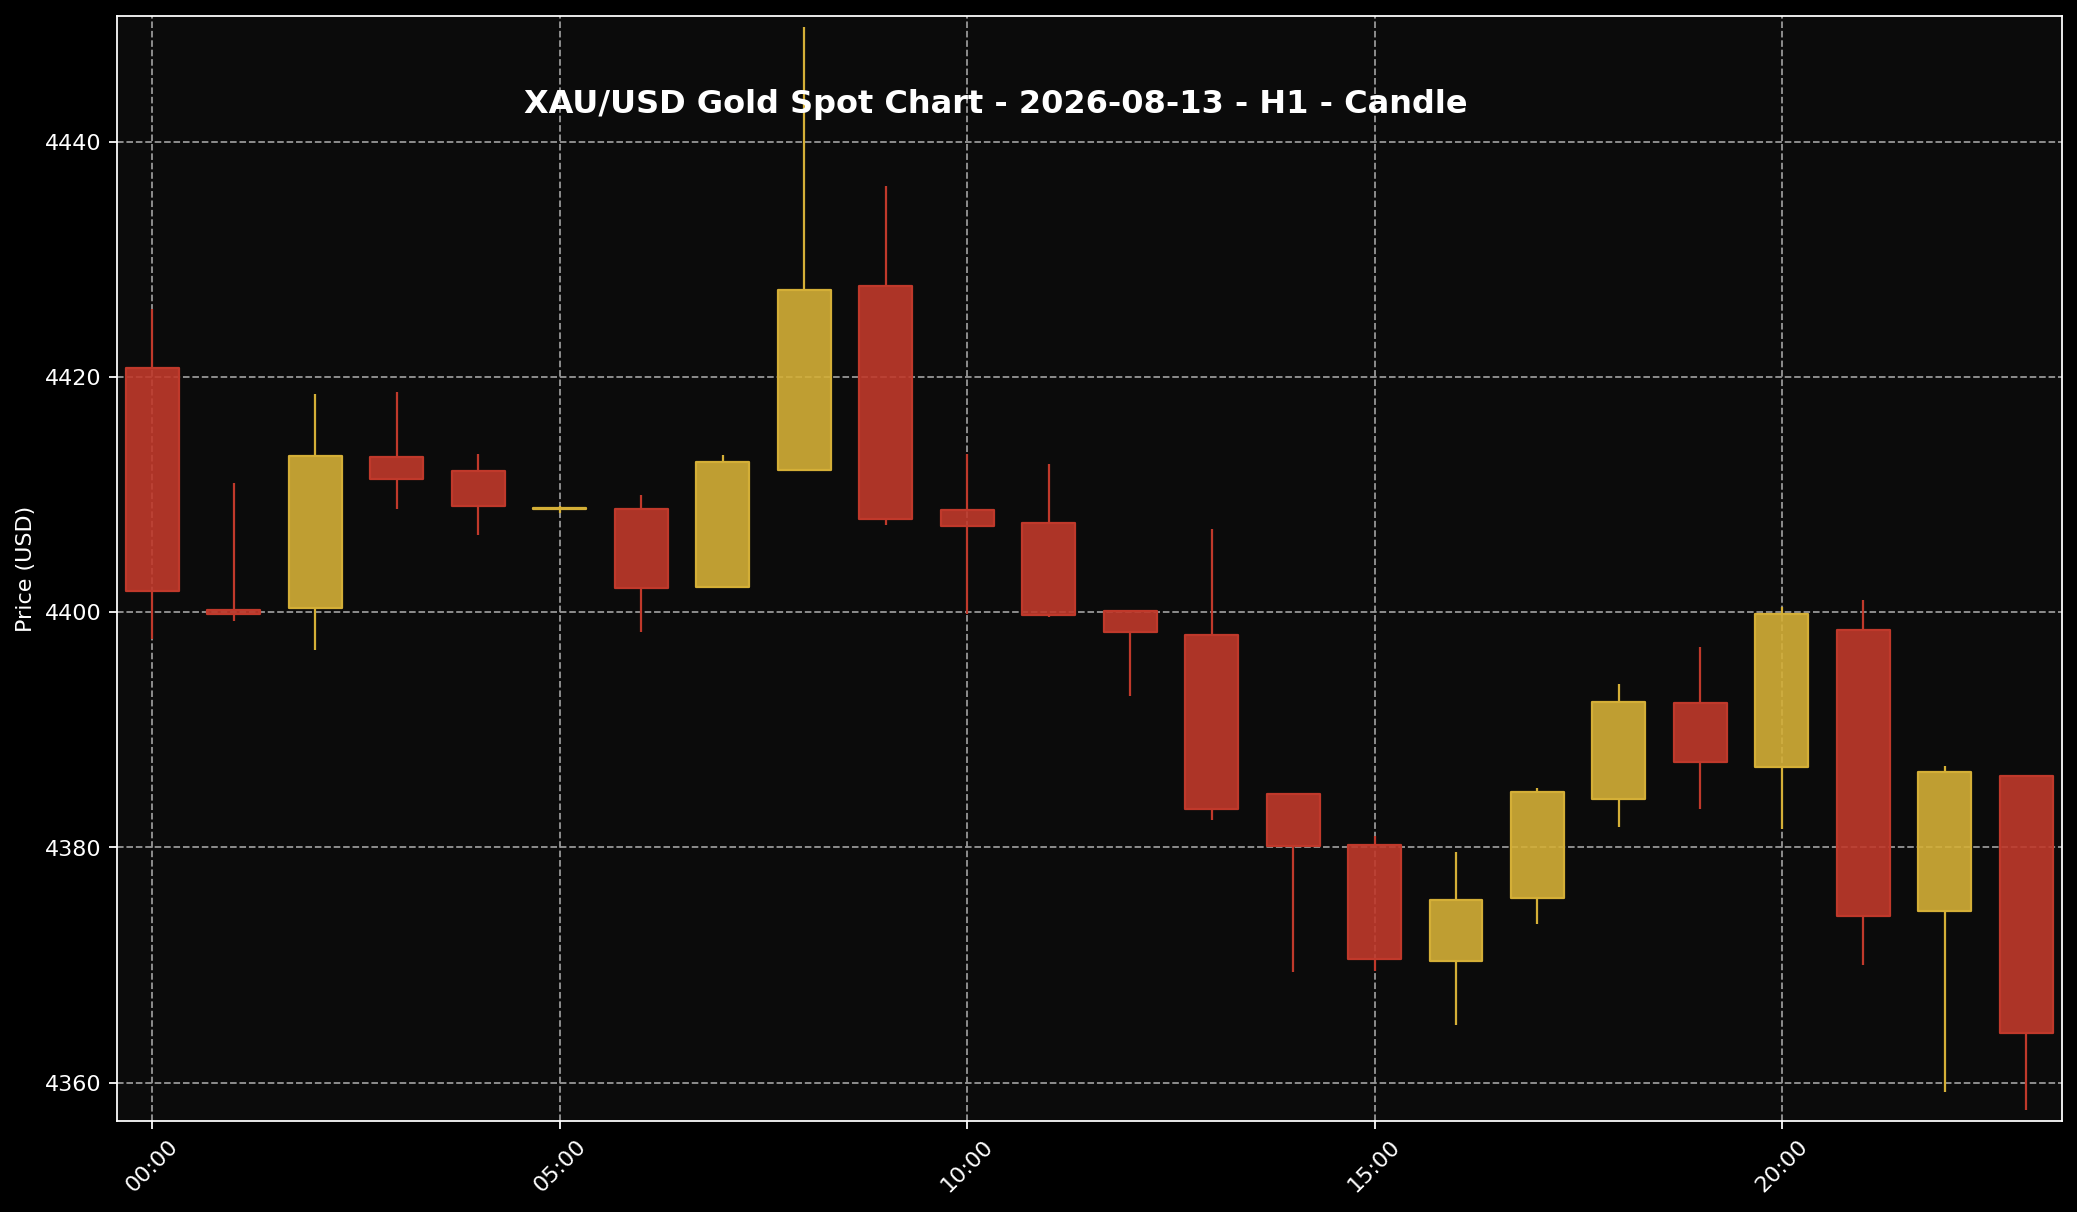 This chart helps readers see the gold price structure for the 13 August 2026 market session. It is used as market context and price-structure reference only.
1. Looking at the H1 gold chart for 13 August 2026, gold did not move in one clean straight line. There was an early attempt to stay stronger, but the price could not hold the upper area for long. After that, the structure started to show more selling pressure through the session.
2. The middle part of the session showed the main change in tone. Gold tried to recover for a while, but the recovery was not strong enough to change the daily picture. By the later part of the session, gold still looked like it had lost the earlier momentum rather than built a fresh push higher.
3. I would not read this chart as a trading signal. The better way to see it is as market structure. Gold tried to continue higher, failed to hold the move, and then gave back part of the earlier gain. That fits the bigger story: the market was digesting US inflation data while traders took money off the table after several days of strength.
Why Did Gold Move This Way?
 The US dollar is often one of the key factors influencing gold prices. When the dollar is firmer, gold can face more noticeable pressure.
1. The main trigger came from US producer inflation data. The headline PPI looked flat, but the core price pressure was still firmer. In plain English, the market could not simply say, “inflation pressure is gone now.” Some parts looked cooler, while other parts still showed that underlying prices were not fully settled.
2. Usually, lower US Treasury yields can help gold. Treasury yields are the returns investors can get from US government bonds. When those returns rise, some investors may prefer bonds because gold does not pay interest. When yields ease, that pressure on gold can reduce. But on this day, the story was not moving in one direction only.
3. Gold had already risen for four days and touched a two-month peak. So when the new inflation data arrived, some traders chose to take earlier gains instead of chasing the move higher. At the same time, if short-term inflation fear looks less urgent, some demand for gold as an inflation hedge can also cool. So gold slipped because of a mix of profit-taking, mixed inflation signals, and weaker near-term inflation-hedge demand.
What Does This Mean For Malaysian Gold Savers?
 For Malaysian gold savers, the key point is not only whether prices rise or fall. What matters more is budget, discipline and a clear purpose.
1. For Malaysian gold savers, the first takeaway is that global gold does not move up in a straight line. Even when the longer-term gold story remains interesting, the daily price can still pull back. That can happen when the market feels the previous rise was already fast enough, or when traders decide the short-term move has gone far enough for now.
2. The second point is Ringgit translation. Looking at XAU/USD alone is not enough for readers in Malaysia. Gold is priced globally in US dollars, but Malaysians feel the price in Ringgit. In this snapshot, USD4,364.18 per troy ounce translated into around RM573.38 per gram on a global spot basis. If USD/MYR changes, the local reading can feel different even if the global gold chart does not move much.
3. One thing I always like to separate clearly at Sifu Gold is this: global spot gold is not the same as local physical gold pricing. Physical gold can include product premium, buy-sell spread, operating cost, logistics and local pricing structure. So the chart helps us understand market direction. Physical gold pricing has its own local calculation.
What Practical Action Makes More Sense?
 When gold prices move quickly, better decisions usually come from disciplined planning, not panic reactions.
1. If you already have a monthly gold-saving budget, a day like this can be a good time to review the plan. Not simply because the price fell for one day, but because it gives you a chance to ask better questions. Does the purchase still fit your budget? Does it match your long-term saving goal? Are you buying according to plan, or reacting to the day’s movement?
2. In my view, it is better not to go in heavily all at once just because the price looks lower for a day. If your cash flow allows it, splitting the budget into smaller purchases can be more manageable. That way, you are not relying too much on one price or one market day. Household commitments, family needs, emergency savings and basic cash flow should still come first.
3. If you are still unsure, waiting can also be a disciplined choice. Watch four things first: the global gold direction, USD/MYR, US Treasury yields and current local physical gold pricing. For gold savers, the goal is not to catch the lowest price perfectly. The more practical goal is to build grams according to ability, understand the cost of buying and selling, and keep a plan that does not disturb your monthly life.
Conclusion
Gold slipped on 13 August 2026 after the market digested US producer inflation data and traders took money off the table following several days of gains. Even though Treasury yields eased, that was not enough to keep gold moving higher. The market was still weighing inflation signals, US rate expectations and whether near-term demand for gold as an inflation hedge was still strong enough. For me at Sifu Gold, this kind of day is useful as a learning point. A one-day drop does not mean the whole gold story is broken. A few strong days also do not mean we should chase price without checking the budget. If you already have a saving plan, continue in stages according to your ability. If you are just starting, the Gold Accumulation Program by Public Gold lets you begin saving gold from as low as RM100, which can help you build grams gradually without committing the full budget at once.

