


What happened to gold on 13 September 2026? The new trading week had only just started on Sunday night, so this was not a full fresh session. Gold was beginning to move again, but the market had not yet shown a clear direction. For the fairest comparison, Friday, 11 September 2026 remains the last completed session. That session left two ideas in focus: inflation kept a possible Fed rate rise in play, while buying after the dip and a softer US dollar helped gold recover.
- Introduction
- What Happened To Gold On 13 September 2026?
- What Is The Gold Chart Showing?
- Why Did Gold Move This Way?
- What Does This Mean For Gold Savers?
- Conclusion
What Happened To Gold On 13 September 2026?
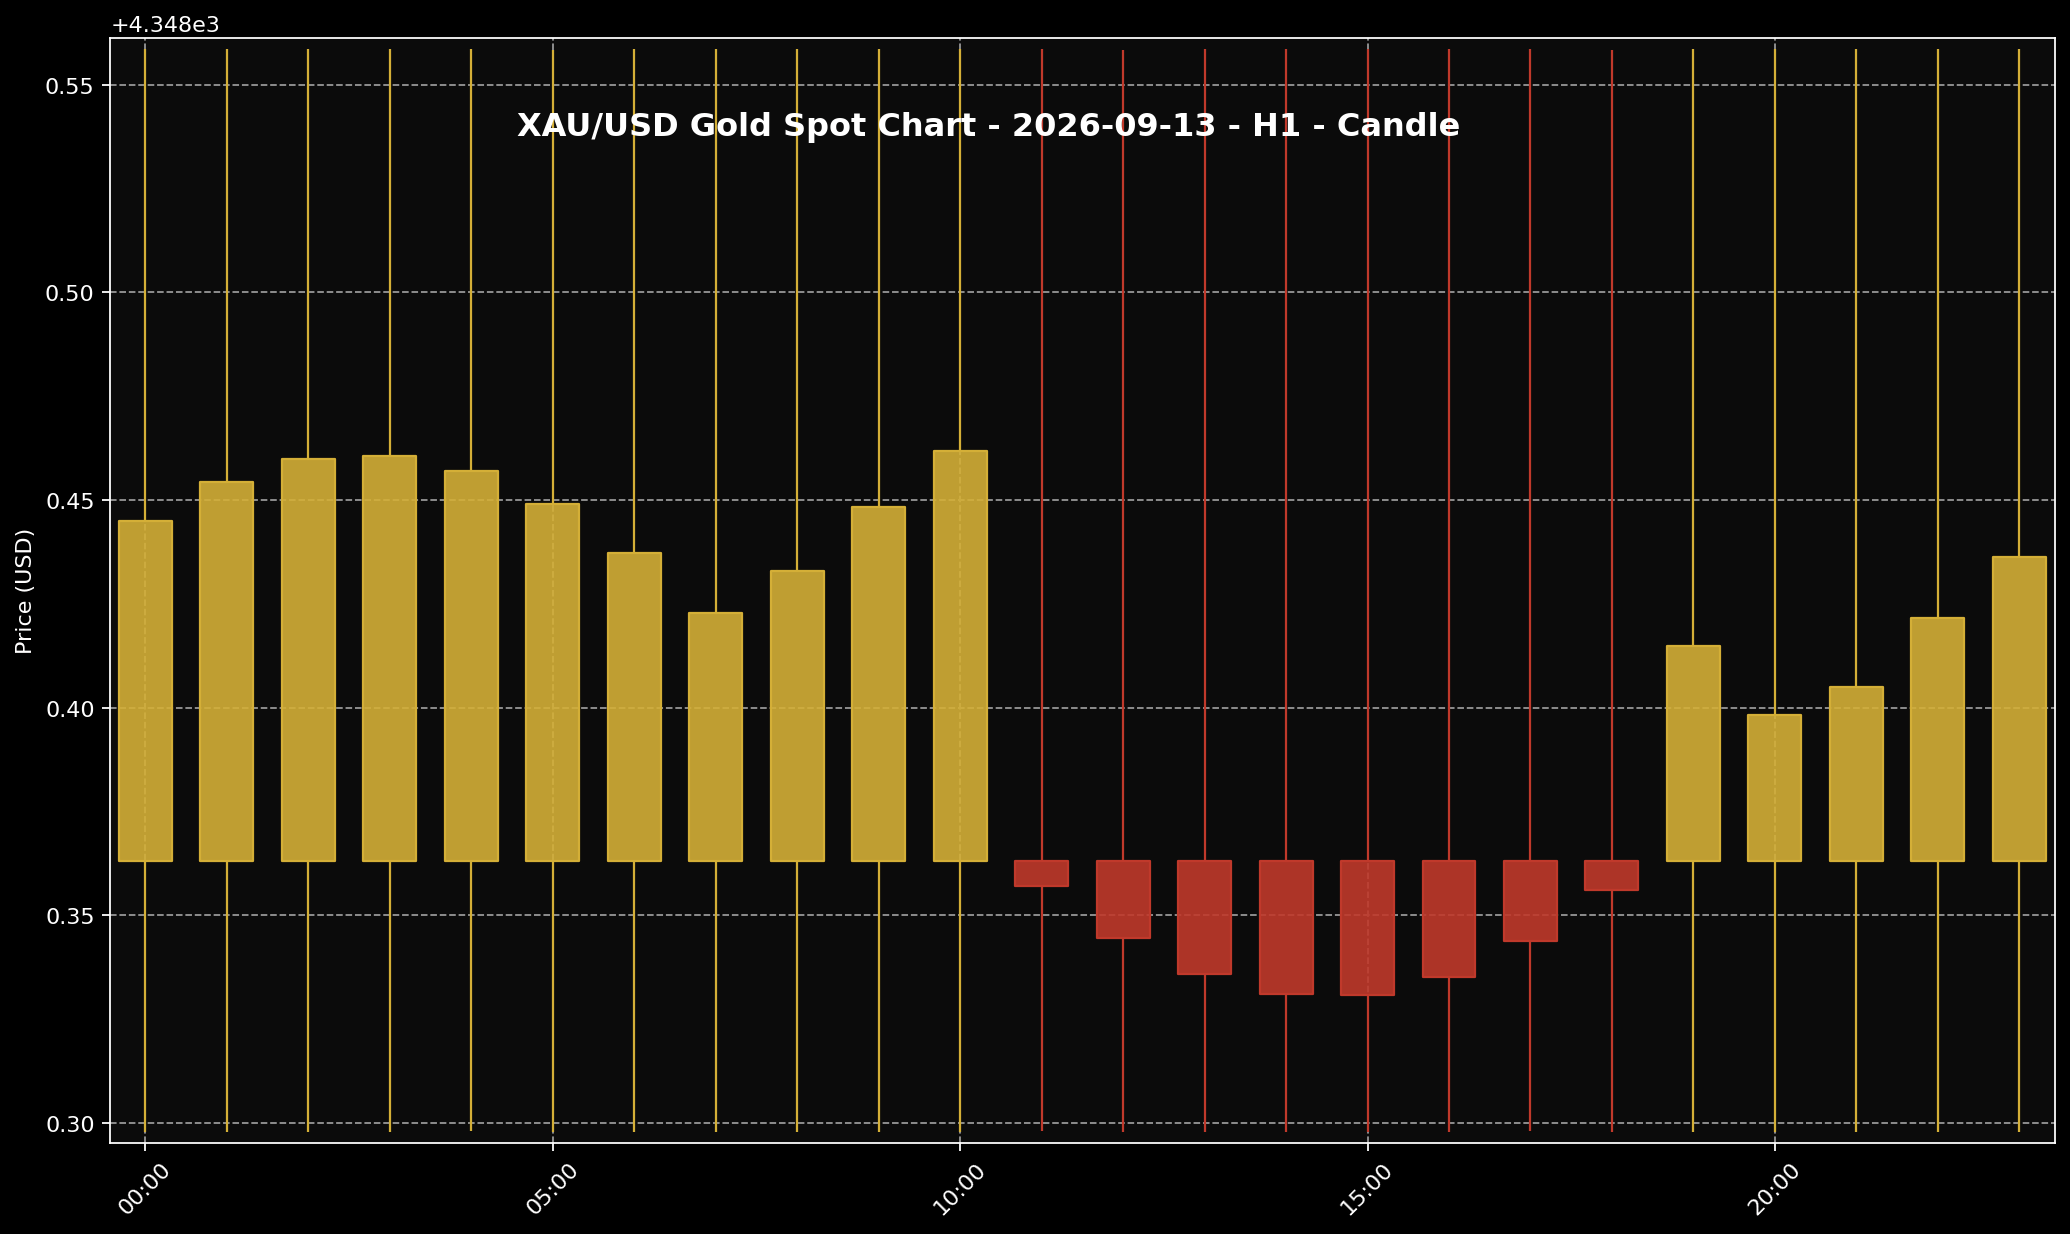 This chart shows the XAU/USD movement for the 11 September 2026 (historical reference; weekend market closed) market session. Sifu Gold uses it as a visual reference, not a cue to buy emotionally.
1. As the market began to reopen at around 11:00 PM Malaysia time on 13 September 2026, XAU/USD was recorded near USD4,348.44 per troy ounce. That worked out to roughly USD139.81 per gram. This was an early-week reading rather than the closing price of a completed daily session.
2. With USD/MYR around 4.07085, the same global spot price was worth approximately RM17,701.83 per troy ounce or RM569.13 per gram. These Ringgit figures are simply conversions of the global spot price. They are not the physical retail gold prices that Malaysian buyers would see from a local provider.
3. Because 13 September fell on a Sunday, Friday, 11 September remains the fairest completed-session comparison. Gold had managed to hold around the USD4,300 area and recover from earlier pressure towards the end of Friday. The reading near USD4,348 on Sunday night showed where gold stood as the new week began, but it was still too early to say that a fresh direction had formed.
What Is The Gold Chart Showing?
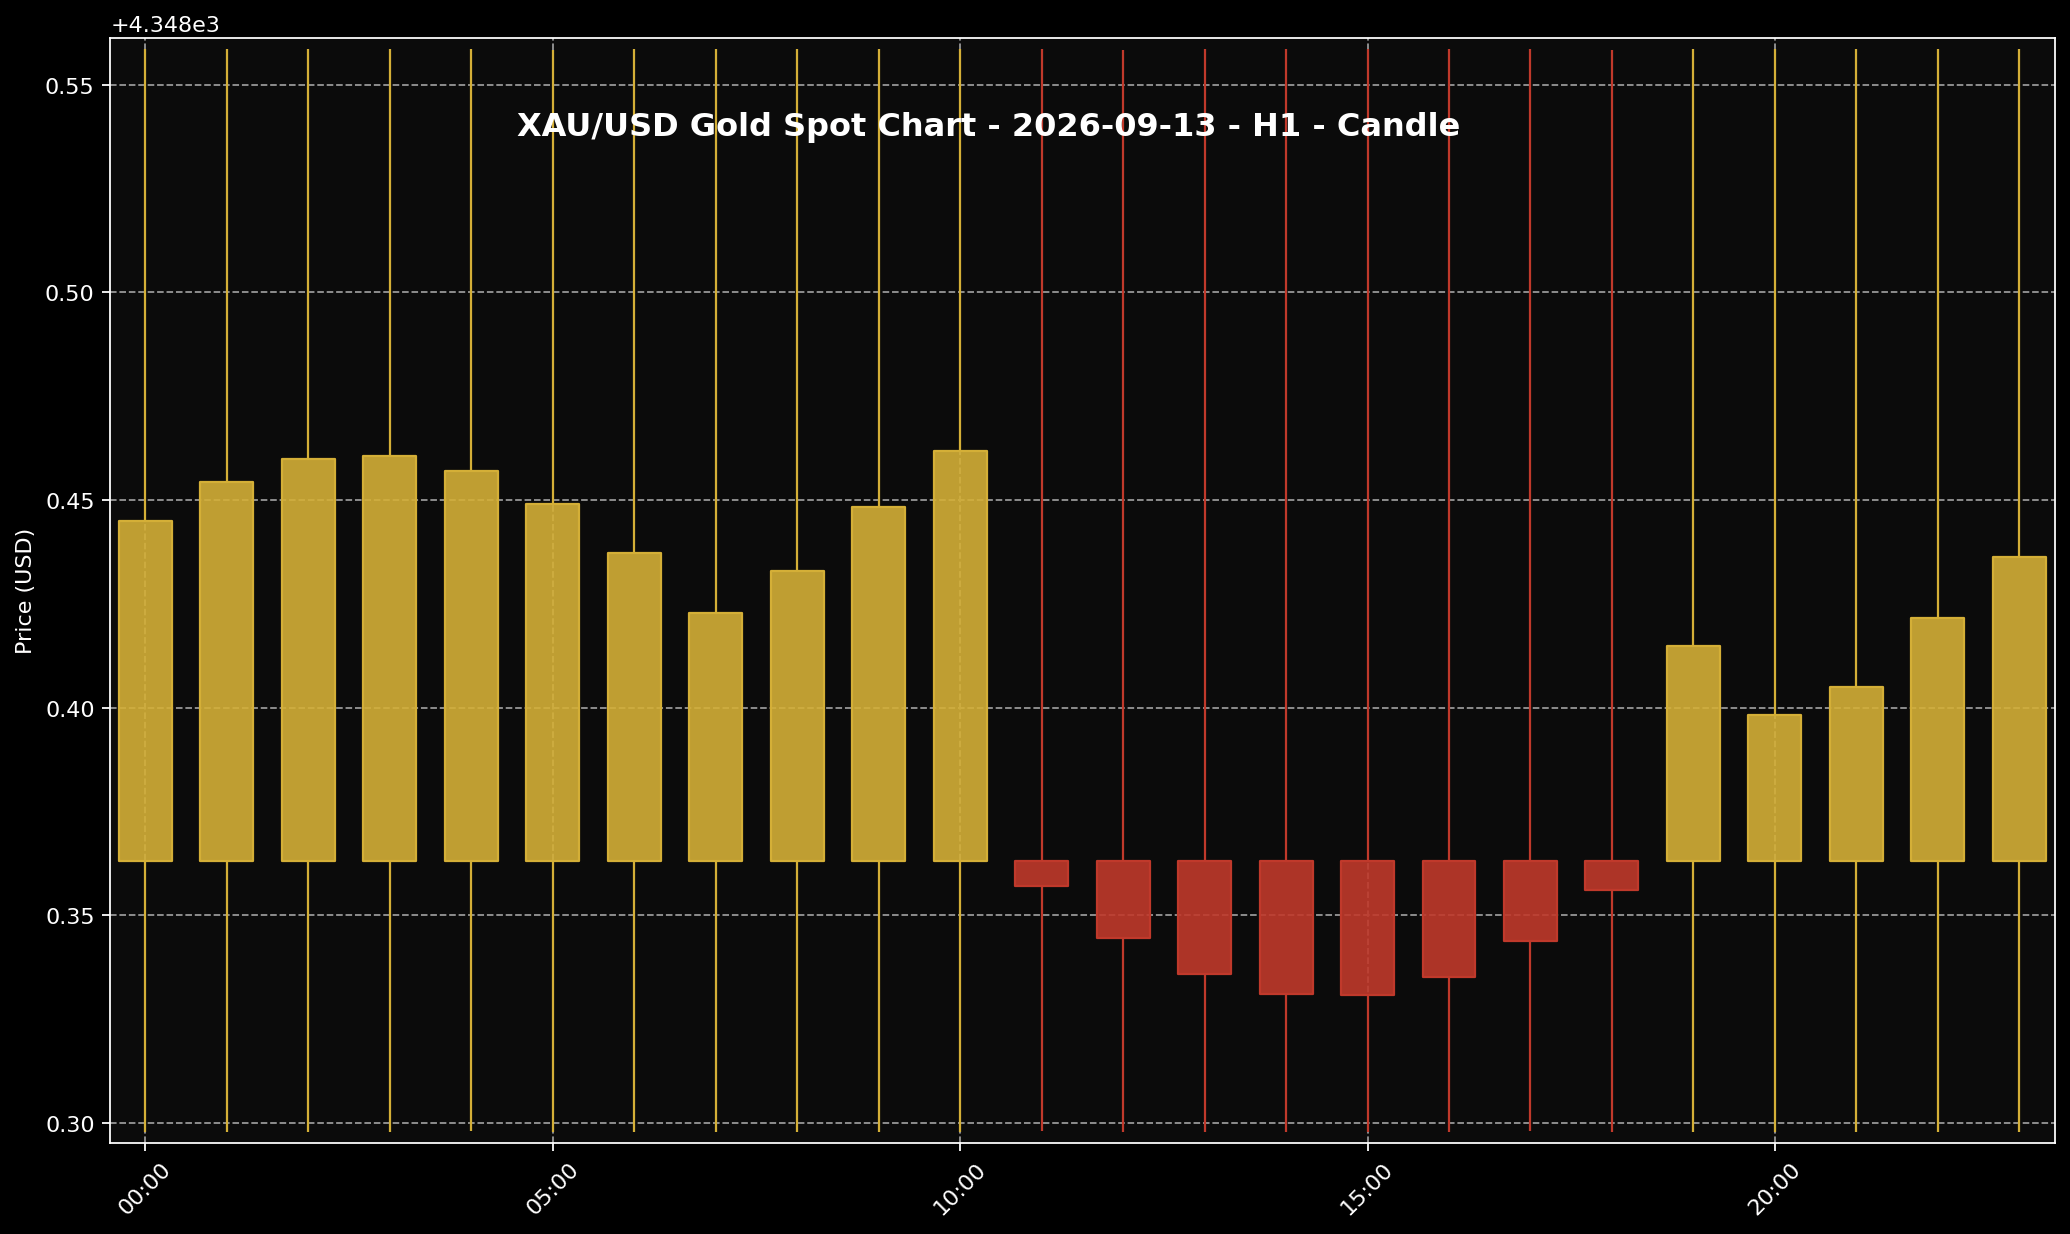 This chart helps readers see the gold price structure for the 11 September 2026 (historical reference; weekend market closed) market session. It is used as market context and price-structure reference only.
1. Looking at the one-hour chart, price movement during this reopening stage was very tight. The candle opened near USD4,348.36 and ended around USD4,348.44, with only a small difference between the two. Put simply, neither buyers nor sellers had taken clear control at that point.
2. Gold was also sitting above the USD4,300 area that it had defended late on Friday. That may look encouraging at first glance, but one small candle at the start of a new week is not enough to confirm a stronger recovery. More market participation was still needed before the chart could give us a clearer picture.
3. The more useful thing to watch was whether gold could remain steady as the week moved into its more active sessions. If price later began moving more consistently, the shape of the week would become easier to read. At this early stage, however, the chart was only showing a narrow reopening phase. It was not confirming a breakout, a reversal or a new daily trend.
Why Did Gold Move This Way?
 The US dollar is often one of the key factors influencing gold prices. When the dollar is firmer, gold can face more noticeable pressure.
1. The main story carried over from Friday came from US inflation. Core inflation was higher than expected, which kept the possibility of another Federal Reserve rate rise in the market’s mind. This made it harder for gold to build a strong and straightforward recovery.
2. Why does that matter? When interest rates are expected to rise, assets that pay interest can look more attractive to some investors. Gold does not pay interest, so expectations of a higher Fed rate can limit its appeal in the short term. That does not remove gold’s longer-term role, but it can make the price more sensitive while the market works out what the Fed may do next.
3. Friday was not driven by one factor alone. Buyers returned after the earlier price decline, while a softer US dollar later in the session also took some pressure off gold. Gold therefore entered the new week with two forces still pulling in different directions: Fed uncertainty was limiting momentum, while buying at lower prices was helping it hold up. By Sunday night, there was not yet enough fresh market activity to replace that carry-over story.
What Does This Mean For Gold Savers?
 For Malaysian gold savers, the key point is to understand the gap between global spot price and local physical price, then act according to budget and discipline.
1. For a Malaysian gold saver, this early reading is better treated as a reference rather than proof of where gold will go for the whole week. The global spot value was around RM569.13 per gram, but the Sunday reopening had not yet produced a complete market direction.
2. Global spot gold is not the same as local physical gold. The price Malaysian buyers actually see can also reflect USD/MYR, product premiums, buying and selling spreads, operating costs and the provider’s local pricing structure. That is why RM569.13 per gram should not be read as a physical retail price.
3. If your aim is to save gold for the long term, check your monthly budget, emergency savings and the spread before deciding. A small, staged purchase may be considered if a dedicated gold budget is already available, but there is no need to commit the full budget at once. Waiting for a clearer session also makes sense if the market direction or your cash flow is still uncertain.
Conclusion
Gold was around USD4,348.44 per troy ounce as the new trading week began on 13 September 2026. This Sunday reading was still part of the reopening stage, not a completed fresh session. Friday, 11 September remains the fairest reference, with Fed rate uncertainty holding gold back while buying after the dip and a softer US dollar helped it recover. The way I see it at Sifu Gold, there is no need to guess the week’s direction from one early reading. Build your decision around your goal, budget and saving period instead. For those who want to build their gold holdings bit by bit, the Gold Accumulation Program by Public Gold allows you to start saving gold from RM100. The focus remains on consistency and affordability rather than reacting to every short-term price move.

