


What happened to gold on 14 September 2026? It fell nearly 2% and touched its lowest level in more than a month, even as uncertainty in the Middle East kept some safe-haven interest alive. The bigger pressure came from surging oil prices, inflation concerns and US Treasury yields moving close to 5%. Together, they made the market think the Fed might need to keep policy tighter or even consider another rate rise. For Malaysian gold savers, the useful question is how this global move translates into Ringgit and what it means for a long-term saving plan.
- Introduction
- What Happened To Gold On 14 September 2026?
- What Is The Gold Chart Showing?
- Why Did Gold Move This Way?
- What Does This Mean For Gold Savers?
- Conclusion
What Happened To Gold On 14 September 2026?
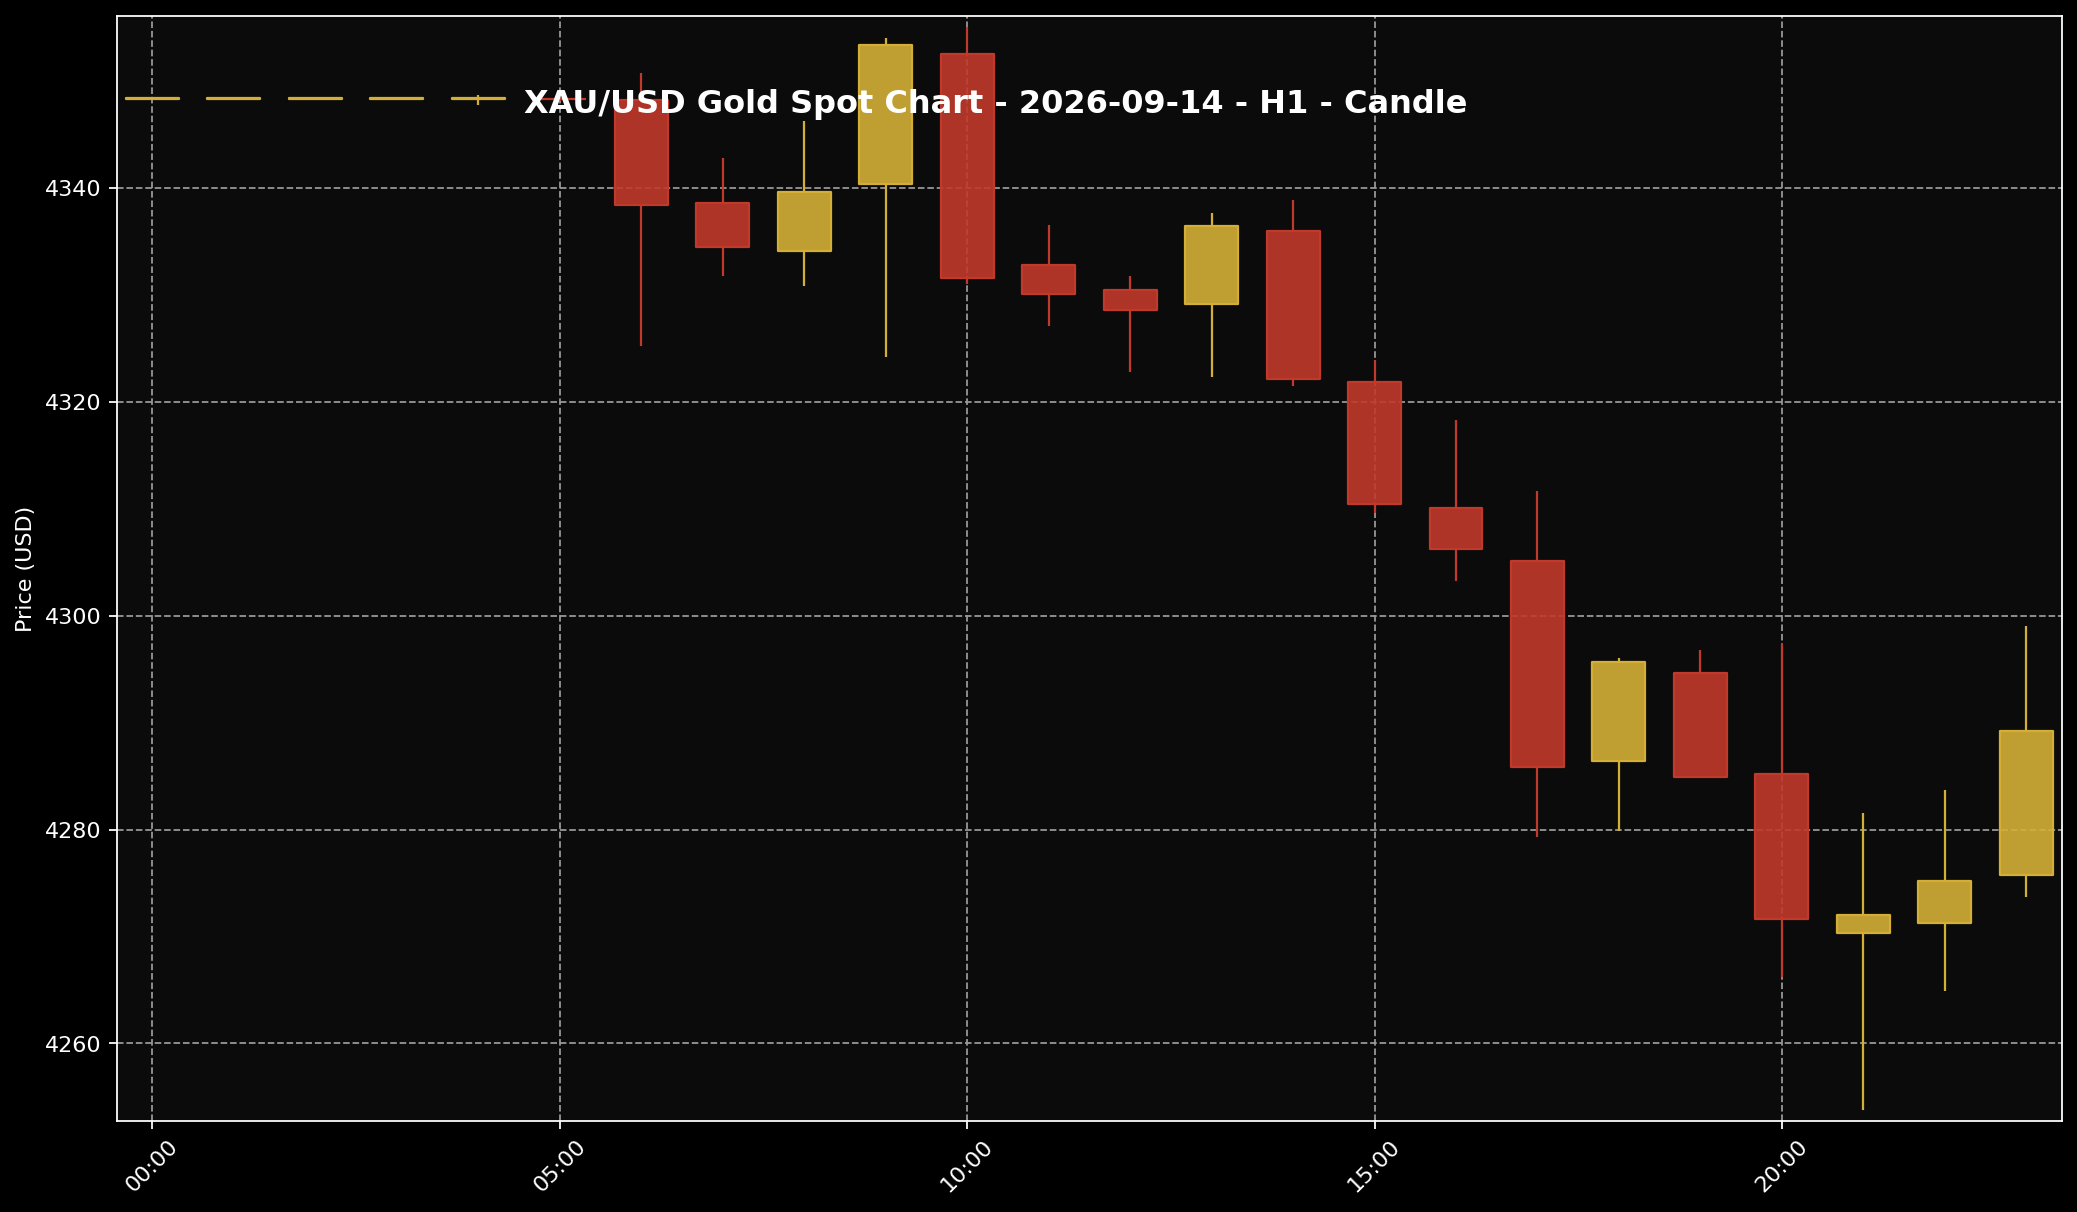 This chart shows the XAU/USD movement for the 14 September 2026 market session. Sifu Gold uses it as a visual reference, not a cue to buy emotionally.
1. At around 11:00 PM Malaysia time, global spot gold stood near USD4,289.26 per troy ounce, or about USD137.90 per gram. Using USD/MYR at around 4.04687, that worked out to roughly RM17,358.09 per troy ounce or RM558.08 per gram. These Ringgit figures are conversions of the global spot price. They are not the retail prices Malaysian buyers would pay for physical gold.
2. Gold had traded around the higher area of USD4,355.11 earlier in the session. That strength did not last. Selling pressure then pulled the price towards USD4,253.79 before it recovered to around USD4,289.26 by the 11:00 PM snapshot. So there was a late bounce, but it only recovered part of the earlier fall.
3. Put simply, the main story was still a weak session rather than a full recovery. Gold fell nearly 2% and reached its lowest level in more than a month. The late rebound showed that some buyers returned at lower prices, but gold remained below USD4,300 and well below the higher area seen earlier in the day.
What Is The Gold Chart Showing?
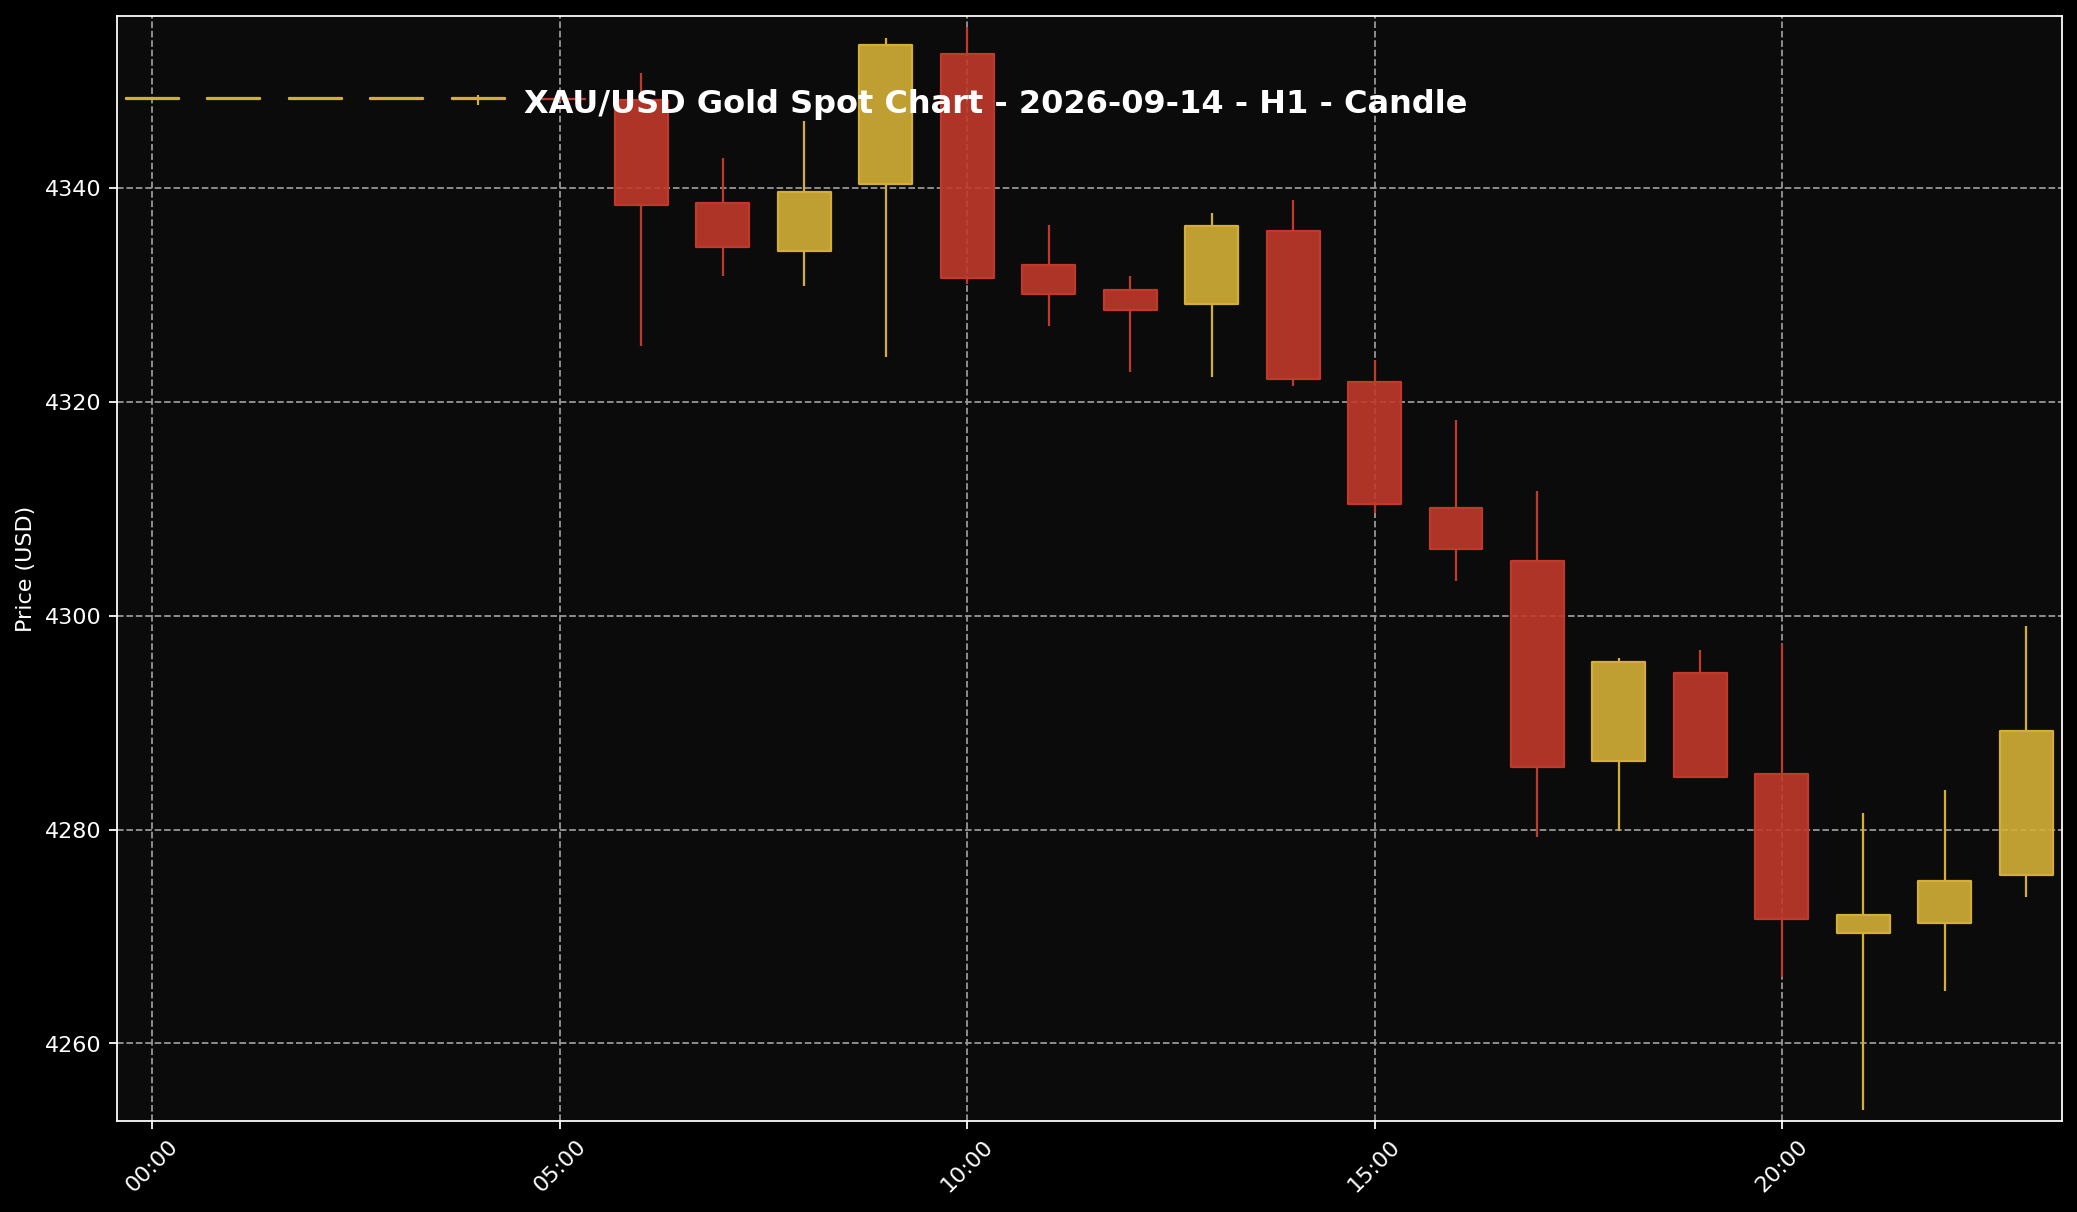 This chart helps readers see the gold price structure for the 14 September 2026 market session. It is used as market context and price-structure reference only.
1. The hourly chart shows that gold tried to hold near USD4,350 early in the session, but could not stay there. More red candles appeared as the day continued, and the price gradually moved below USD4,300. In simple terms, sellers had more control for most of the session.
2. Buyers started to return after gold reached the lower area around USD4,250. That helped the price climb back towards USD4,289. Even so, the rebound did not carry gold back to where it began. It was a partial recovery from the day’s low, not a complete change in direction.
3. The chart is most useful here as a picture of how the session unfolded. Gold moved from a higher area to a lower one, then recovered part of the decline. A few stronger candles near the end were not enough on their own to erase the broader pressure. For gold savers, this is a reminder that one late bounce does not always tell the whole story. The full-day movement matters too.
Why Did Gold Move This Way?
 The US dollar is often one of the key factors influencing gold prices. When the dollar is firmer, gold can face more noticeable pressure.
1. The clearest trigger was the surge in oil prices alongside fresh inflation concerns. When energy becomes more expensive, the market starts to worry that inflation may remain high. That led traders to think the US Federal Reserve might have to keep monetary policy tighter or consider another rate rise. This was a change in market expectations, not an official Fed decision.
2. US Treasury yields then moved close to 5%. A Treasury yield is simply the return investors can earn from holding US government bonds. When that return becomes more attractive, some investors may prefer bonds over gold because gold does not pay interest. That makes it harder for gold to hold its momentum, especially when the market is already worried about higher rates.
3. At the same time, uncertainty in the Middle East still created some demand for gold as a safe-haven asset — something investors often hold when the world feels less certain. But that support was not strong enough to outweigh the pressure from oil, inflation concerns and higher bond yields. Gold does not automatically rise every time geopolitical tension increases. The market still compares it with interest-paying alternatives and the wider rate outlook.
What Does This Mean For Gold Savers?
 For Malaysian gold savers, the key point is to understand the gap between global spot price and local physical price, then act according to budget and discipline.
1. For Malaysian gold savers, a nearly 2% fall is useful market information, but it does not have to change a long-term saving plan overnight. The better questions are whether the gold is meant for long-term savings, whether the holding period is suitable, and whether the day’s move has genuinely changed the original purpose.
2. The RM558.08 per gram figure is only the global spot price converted into Ringgit. Local physical gold can be priced differently because of USD/MYR, product premiums, buy-sell spreads, operating costs, logistics and each provider’s pricing structure. The number on an international chart will therefore not always match the price Malaysian buyers see.
3. If you already have a dedicated monthly gold budget, a small purchase made in stages may be considered. There is no need to commit the full budget at once simply because gold fell for one session. Keep monthly commitments, emergency savings and cash flow protected. If the budget is not ready or you would rather see the market settle first, waiting can also be a disciplined choice.
Conclusion
Gold fell on 14 September 2026 as surging oil prices and inflation concerns lifted expectations that US rates could stay tighter, while Treasury yields moved close to 5%. That pressure outweighed the safe-haven demand linked to uncertainty in the Middle East. Gold did recover from its lowest area later in the session, but the rebound did not erase the day’s broader decline. The way I see it at Sifu Gold, there is no need to guess the exact bottom from a single day’s movement. Build the decision around your purpose, budget and saving period. If you want to accumulate gold little by little, the Gold Accumulation Program by Public Gold allows you to start saving gold from as little as RM100. The main priority is to stay disciplined without disrupting essential expenses or emergency savings.

