


What happened to gold on 15 August 2026 needs to be read a little differently. The global gold market was already in weekend mode, so this was not a fresh active trading session. The better way to read it is to use the latest available market reference, then link the direction back to the last completed session on 14 August 2026. For Malaysian gold savers, the useful point is not just the price number, but what that number means once it is translated into Ringgit.
- Introduction
- What Happened To Gold On 15 August 2026?
- What Is The Gold Chart Showing?
- Why Did Gold Move This Way?
- What Does This Mean For Gold Savers?
- Conclusion
What Happened To Gold On 15 August 2026?
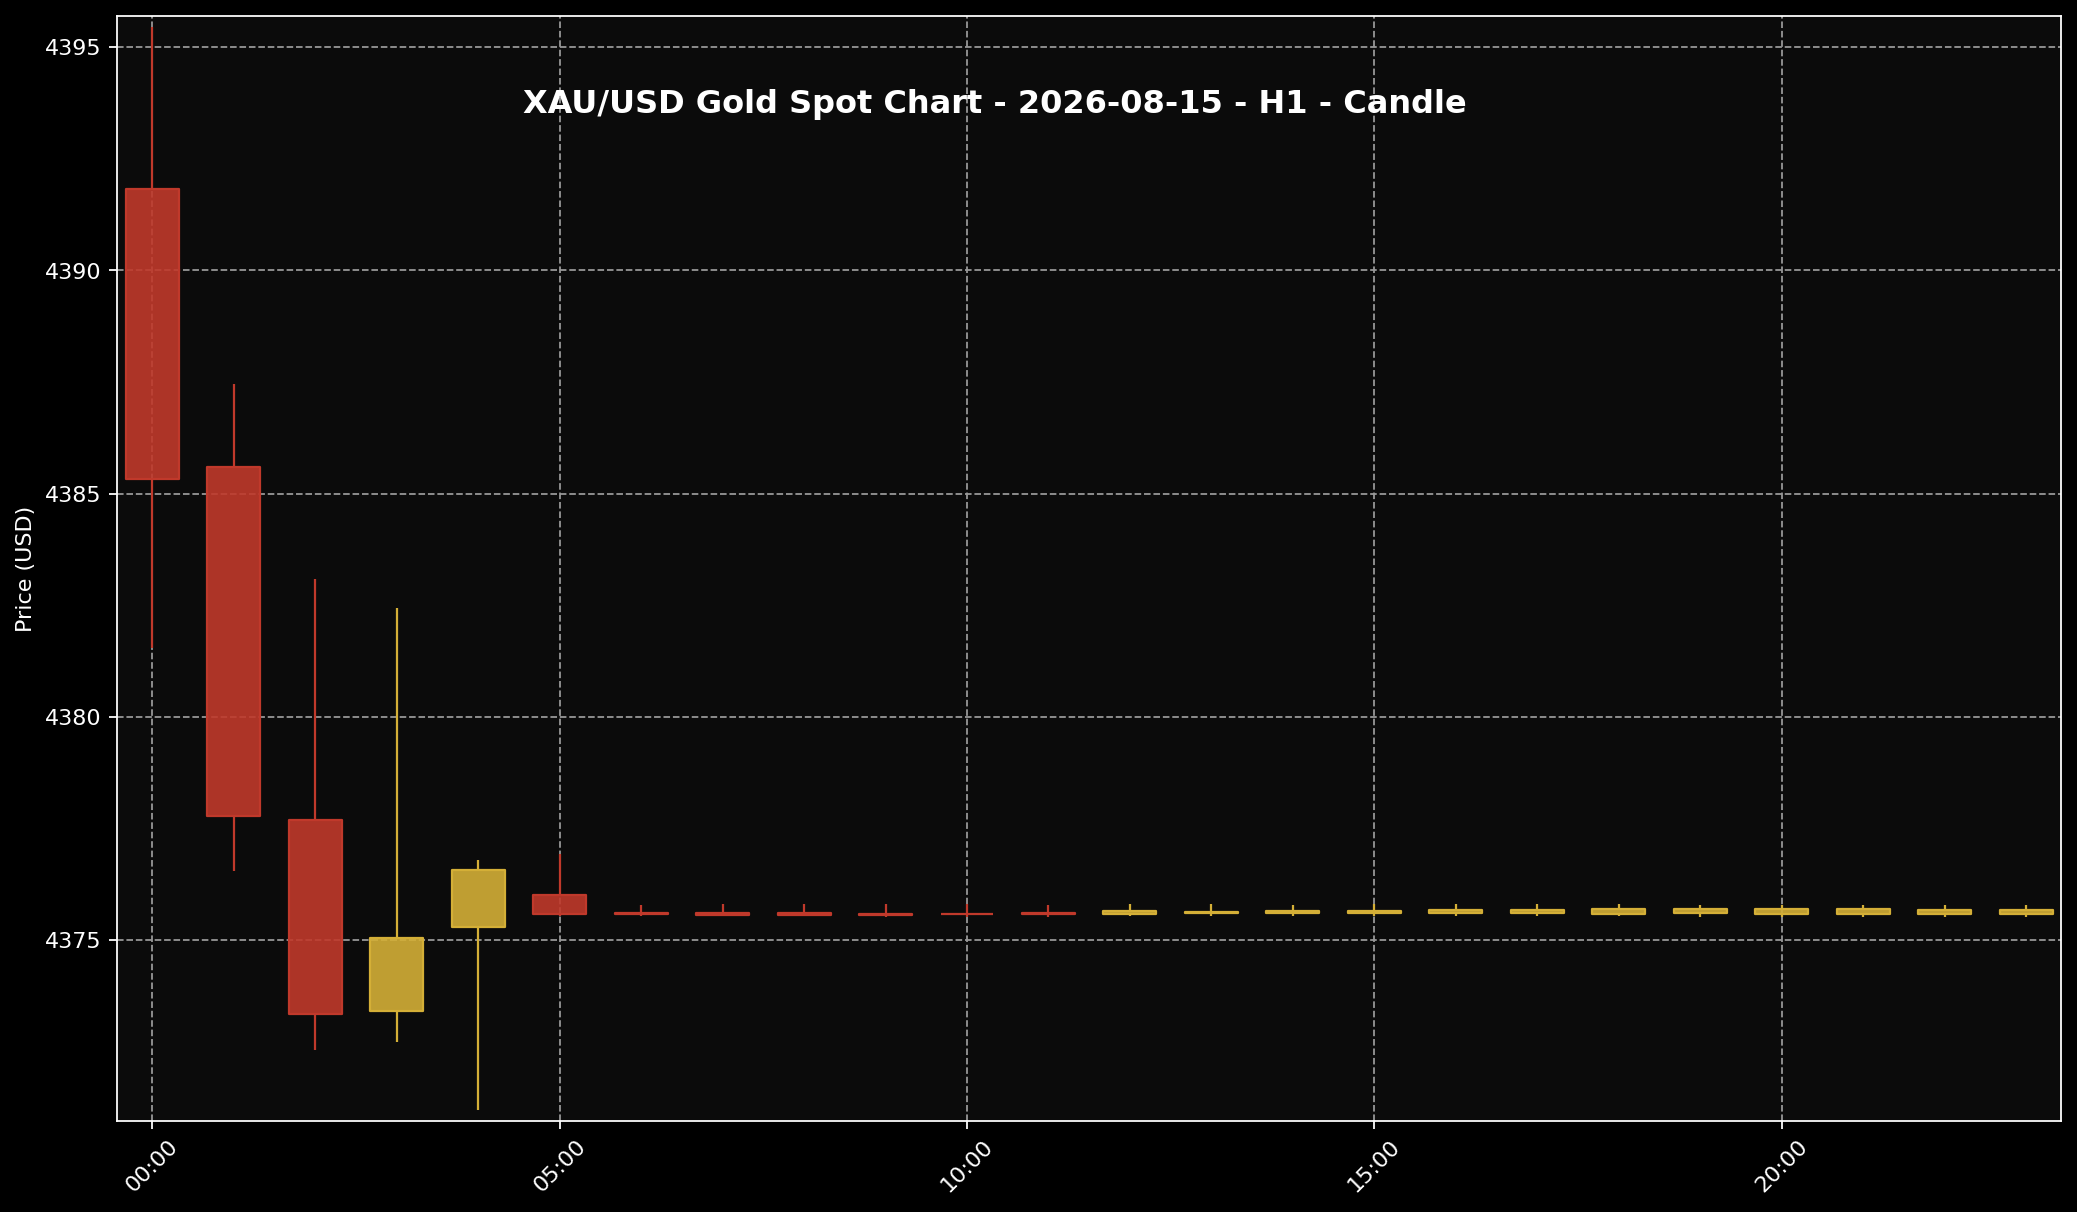 This chart shows the XAU/USD movement for the 15 August 2026 market session. Sifu Gold uses it as a visual reference, not a cue to buy emotionally.
1. On 15 August 2026, gold should be read as a weekend market reference. The major global market was already closed, so I would not treat the date as if a new full Saturday trading session had happened. Around 11:00 PM Malaysia time, the latest available global spot reference placed gold near USD4,375.67 per troy ounce, or about USD140.68 per gram.
2. Using USD/MYR around 4.08621, that works out to roughly RM17,879.90 per troy ounce, or about RM574.85 per gram. This is the global spot price converted into Ringgit. It is not the same as the physical gold price people see locally in Malaysia, because physical gold pricing can include premiums, spreads, product structure, logistics, operating costs and local pricing adjustments.
3. The main market story still comes from the completed session on 14 August 2026. Gold had support after weaker US retail sales reduced the pressure around further Federal Reserve rate hikes. A softer US dollar also helped. At the same time, the move was not completely clear-cut because firmer US Treasury yields and oil-related inflation risk were still part of the background.
What Is The Gold Chart Showing?
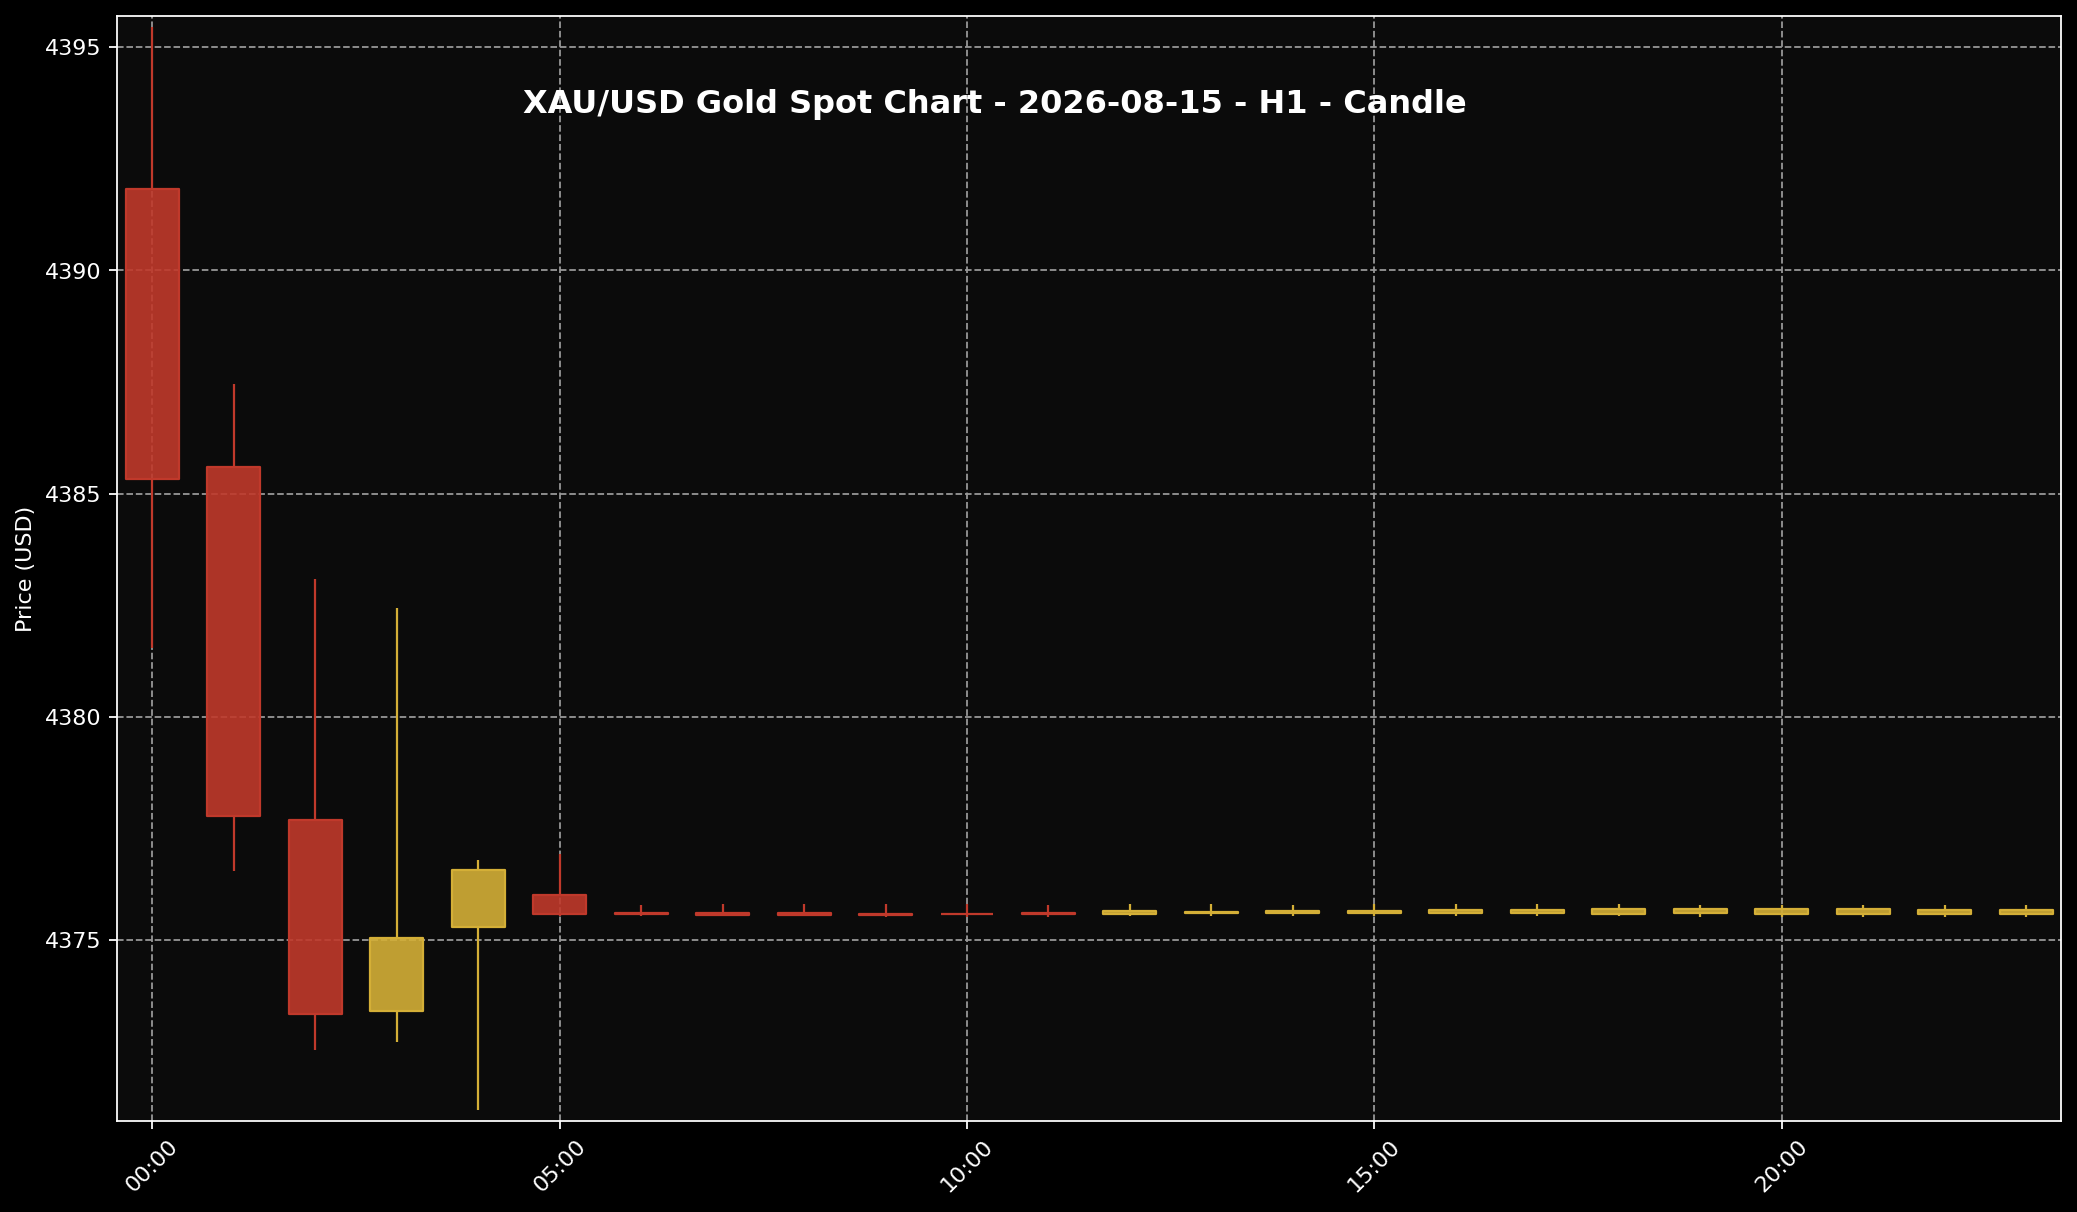 This chart helps readers see the gold price structure for the 15 August 2026 market session. It is used as market context and price-structure reference only.
1. The H1 chart gives a simple structure to the story. Gold had already moved down from a higher area earlier, then settled closer to the USD4,375 to USD4,376 zone. The earlier candles showed clearer pressure, while the later part of the chart looked tighter and less active.
2. Put simply, the chart was not showing a fresh new push by itself. It looked more like gold had pulled back first, then moved in a narrower range. When candles become smaller and sit close together, it usually means the market is either slowing down or waiting for a stronger reason before choosing the next direction.
3. For Sifu Gold readers, I would use this chart as a market structure check only. It is not an instruction to buy or sell, and it is not a trading setup. The useful takeaway is easier: gold was still sitting at a high global price level, but the weekend reference did not create a new direction on its own.
Why Did Gold Move This Way?
 The US dollar is often one of the key factors influencing gold prices. When the dollar is firmer, gold can face more noticeable pressure.
1. The clearest trigger came from the US interest-rate story. When US retail sales came in weaker, the market started to think the Fed may have less reason to keep raising rates aggressively. That matters for gold because higher interest-rate expectations usually make it harder for gold to build momentum.
2. The US dollar also played a role. Gold is priced globally in US dollars. When the dollar eases, gold can become a little more attractive for buyers outside the United States, because the same ounce does not feel as expensive in other currencies. That is one reason a softer dollar can help gold hold up.
3. But the market was still not giving a clean one-way story. Firmer US Treasury yields can limit gold’s upside because gold does not pay interest like bonds do. Oil-related inflation risk also kept the market alert. So the fair reading is this: gold had support from the dollar and Fed-expectation side, but the wider backdrop was still mixed.
What Does This Mean For Gold Savers?
 For Malaysian gold savers, the key point is to understand the gap between global spot price and local physical price, then act according to budget and discipline.
1. For me at Sifu Gold, this kind of weekend reading is better used as a planning reference, not a reason to react emotionally. If you are saving gold for the long term, the bigger question is not whether one snapshot looks higher or lower. The better question is whether the latest market story changes your budget, your plan, or your discipline.
2. For Malaysian gold savers, looking at XAU/USD alone is never enough. The global spot conversion was around RM574.85 per gram, but that is still not the same as local physical gold pricing. The price you see locally can move with USD/MYR, product premium, buy-sell spread, logistics, operating cost and the seller’s pricing structure.
3. In practical terms, follow your own budget. If you already have a monthly gold-saving plan, small staged buying can make more sense than trying to guess one perfect price. If your cash flow is tight, waiting for a better time is also a disciplined choice. The key is not to commit the full budget at once or disturb household commitments just to add more grams.
Conclusion
For 15 August 2026, gold is best read as a weekend reference, not a fresh active trading session. The main direction still links back to 14 August, when weaker US retail sales, softer Fed-hike expectations and a weaker US dollar helped support gold. At the same time, yields and inflation concerns meant the market was still not completely clear. For Malaysian gold savers, use this reading to review the plan. Look at the global spot price, translate it into Ringgit, then remember that local physical gold pricing can still be different. If the budget is ready, build gradually. If the budget is not comfortable yet, sort out cash flow first. For beginners, Gold Accumulation Program by Public Gold allows you to start saving gold from as low as RM100, based on your own ability and discipline.

