


What happened to gold on 15 July 2026 was not a clean bullish push. Gold did recover after US producer inflation came in cooler than expected, and that gave the market a reason to step back into gold after earlier weakness. But the move still did not feel fully settled by the close. Treasury yields remained part of the pressure story, Middle East tension stayed in the background, and the chart showed that buyers had not completely taken control yet. For Malaysian gold savers, that matters more than a simple up-or-down headline.
- Introduction
- What Happened To Gold On 15 July 2026?
- What Is The Gold Chart Showing?
- Why Did Gold Move This Way?
- What Does This Mean For Malaysian Gold Savers?
- What Practical Action Makes More Sense?
- Conclusion
What Happened To Gold On 15 July 2026?
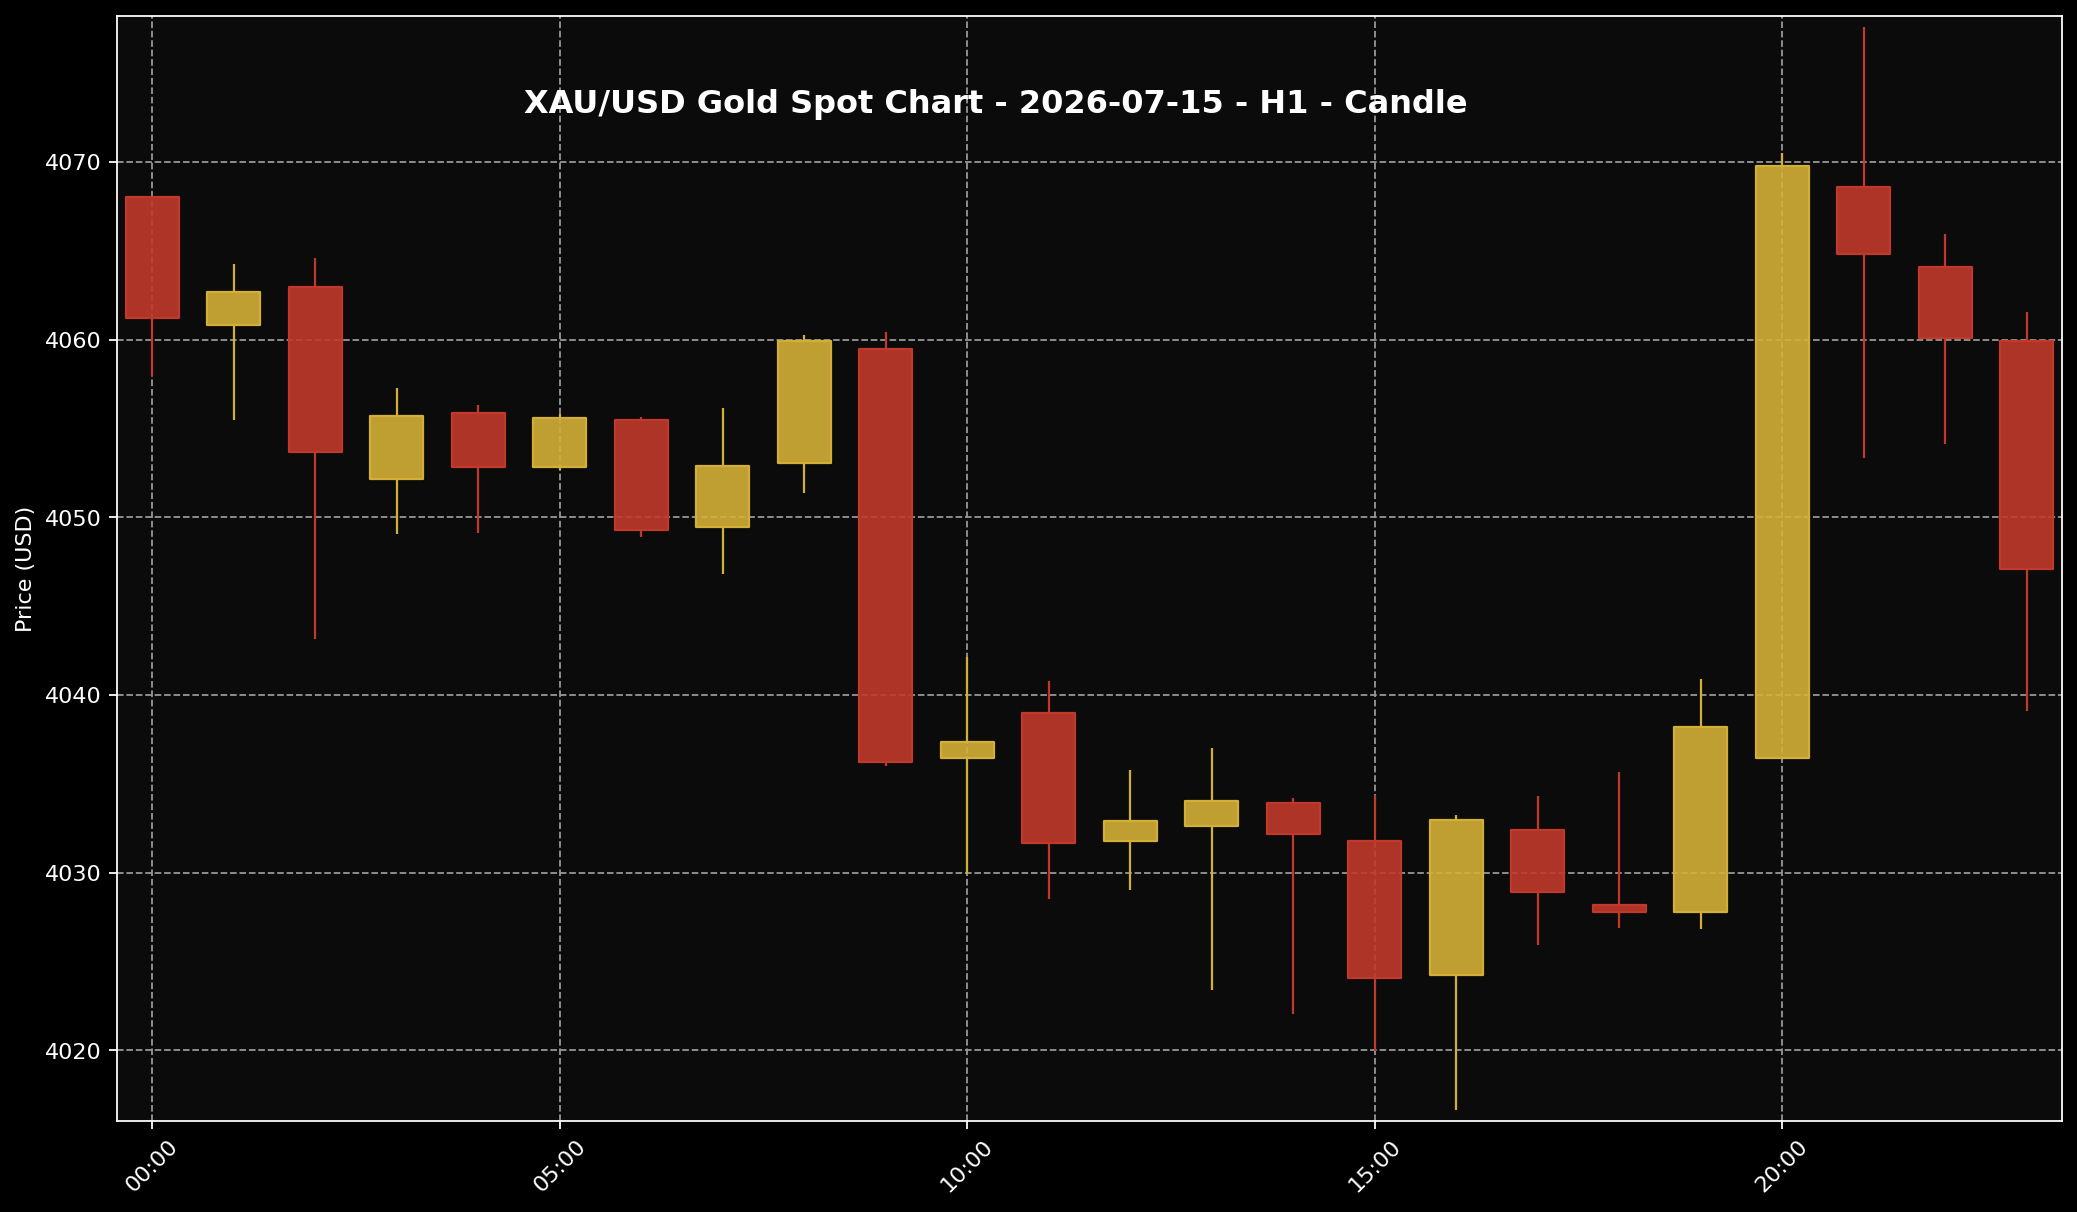 This chart shows the XAU/USD movement for the 15 July 2026 market session. Sifu Gold uses it as a visual reference, not a cue to buy emotionally.
1. By the end of the 15 July 2026 session, at around 11:00 PM Malaysia time, global spot gold was near USD4,047.12 per troy ounce. Broken down into grams, that worked out to about USD130.12 per gram. Using the approved USD/MYR reference of 4.07798 at the same snapshot, the same global spot move translated to roughly RM16,504.07 per troy ounce, or about RM530.62 per gram. These Ringgit figures are global spot conversions, not local physical retail gold prices in Malaysia.
2. The session itself was more mixed than the closing price alone might suggest. Gold came under pressure earlier in the day, then found support after US producer price data showed cooler inflation at the wholesale level. That mattered because softer inflation data can reduce some of the market’s fear that interest rates may need to stay harsher for longer.
3. Still, this was not the kind of move that looked like a fresh breakout. Gold did regain some footing and stayed above the USD4,000 area, but it did not finish close to the best levels of the day. So the better way to read 15 July is this: gold recovered from earlier weakness, but the market still looked careful by the close.
What Is The Gold Chart Showing?
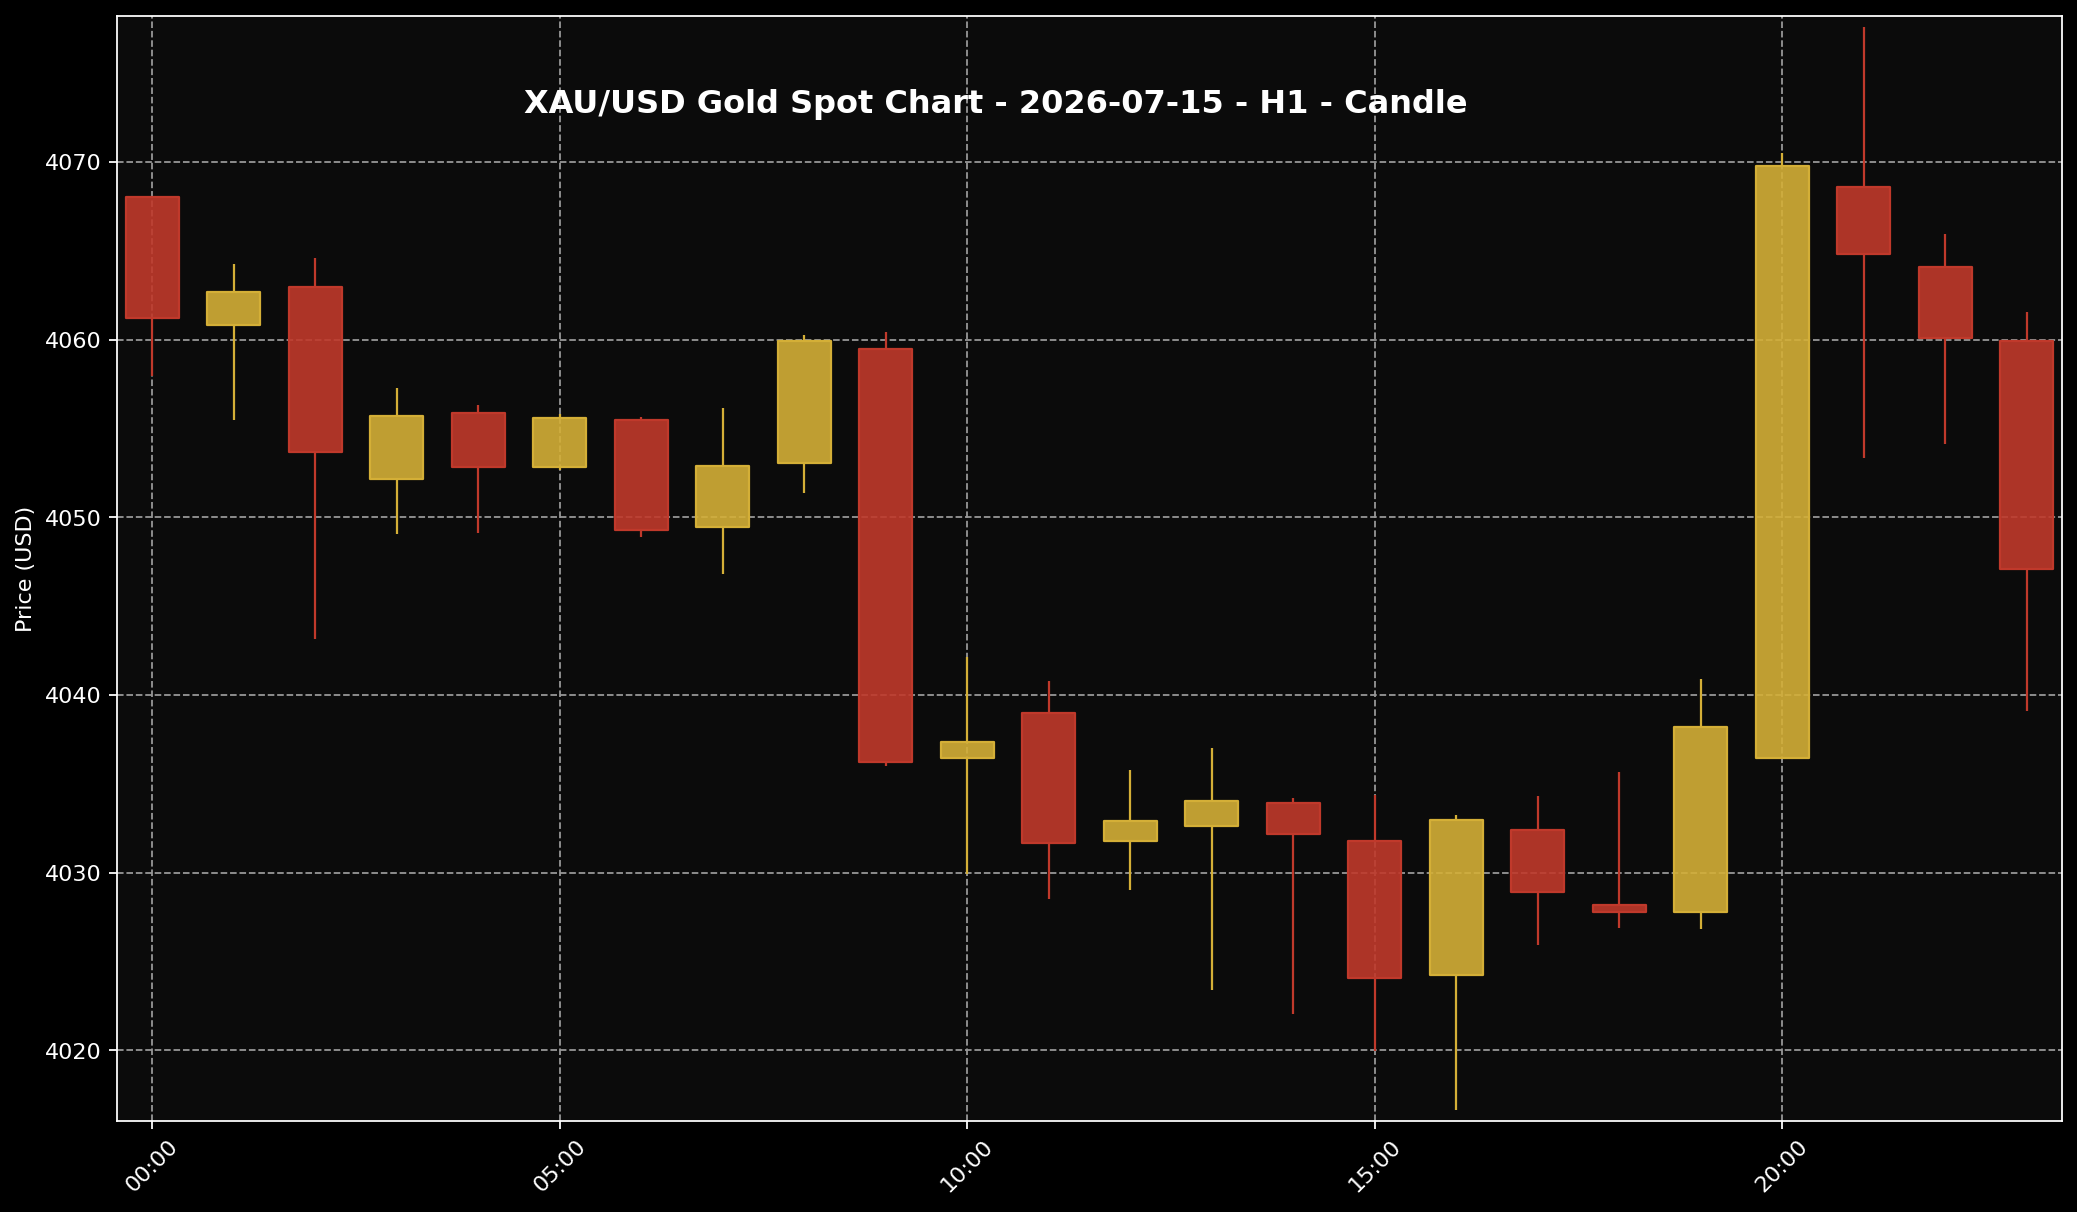 This chart helps readers see the gold price structure for the 15 July 2026 market session. It is used as market context, not as a trading signal.
1. The H1 chart for 15 July showed a day with plenty of back-and-forth movement. Early to mid-session, gold drifted lower and spent time trading in the low-USD4,020s to low-USD4,030s area. That tells us the market did not begin the day in a confident buying mood. There was still pressure in the system before the inflation data helped shift the tone.
2. After that, gold pushed higher again and recovered a good part of the earlier loss. The rebound showed that buyers were willing to return once the market saw cooler producer inflation. But the final stretch of the session still matters. The last hourly candle opened above the close, briefly pushed higher, then settled back to around USD4,047.12. In simple terms, gold recovered, but some of that strength was still being tested into the close.
3. For ordinary readers, the chart looked more like stabilisation after a rebound attempt than a decisive move into a new trend. The USD4,000 area still looked important and held as a psychological support zone. But the higher area still attracted resistance. That is why the chart fits a “recovery, but not fully clear yet” story better than a strong one-way bullish turn.
Why Did Gold Move This Way?
 The US dollar is often one of the key factors influencing gold prices. When the dollar is firmer, gold can face more noticeable pressure.
1. The clearest trigger came from US PPI, or producer price index, data. PPI measures price pressure at the producer level. When that reading comes in cooler than expected, the market can start to think inflation pressure is not running as hot as feared. That usually helps gold because it can reduce some of the pressure behind a tougher interest-rate outlook.
2. But that was only one part of the story. Treasury yields were still elevated, and that matters because gold does not pay interest. When bond yields stay attractive, some investors still prefer income-producing assets over gold, at least in the short term. That is why softer inflation data gave gold support without turning the whole session into a clean rally.
3. At the same time, the market was also watching Middle East tensions. Gold often gets support when geopolitical risk stays in focus because it is seen as a safer store of value during uncertain periods. So what happened on 15 July was really a balance between two forces: cooler US inflation data helped gold recover, while high yields and broader risk concerns stopped that recovery from looking fully convincing.
What Does This Mean For Malaysian Gold Savers?
 For Malaysian gold savers, the key point is not only whether prices rise or fall. What matters more is budget, discipline and a clear purpose.
1. For Malaysian gold savers, the main point is not just that gold closed near USD4,047.12 per ounce. The more useful question is what that move looked like once it was translated into Ringgit. At the approved snapshot, the global spot reference came to about RM16,504.07 per ounce, or roughly RM530.62 per gram. That gives a more relatable benchmark for local readers who track gold in Ringgit rather than US dollars.
2. This is where USD/MYR becomes important. Even when gold gets support from softer US inflation data, the local picture can still feel different depending on the exchange rate. If the Ringgit does not strengthen much, gold in Ringgit terms can still look firm even if the move in USD is not especially aggressive. So for Malaysians, watching gold alone is not enough. Gold and USD/MYR need to be read together.
3. One more point needs to stay clear. The RM530.62 per gram figure is a global spot conversion only. It is not the same as local physical retail pricing. Physical gold in Malaysia can be higher because local pricing also reflects product premium, buy-sell spread, operating costs, logistics, and each seller’s own pricing structure. So some gap between global spot and local physical prices is normal.
What Practical Action Makes More Sense?
 When gold prices move quickly, better decisions usually come from disciplined planning, not panic reactions.
1. From my view at Sifu Gold, a session like this is better read as a reminder to follow a plan rather than react to one day’s move. Gold did recover after the PPI data, but the chart also showed that the rebound was not fully clean by the close. So if someone already has a monthly budget set aside for gold saving, a gradual accumulation approach still makes more sense than committing the full budget at once.
2. If the timing still feels unclear, the better focus is on budgeting and discipline. Check first whether the money being used is genuinely spare cash, not money meant for household commitments, family needs, or emergency savings. For long-term savers, building grams consistently is usually more useful than trying to guess the single best entry day from one mixed session.
3. And if the market still looks unsettled, waiting is also a valid disciplined choice. Keep an eye on Treasury yields, USD/MYR, and whether gold can stay stable above key areas after this rebound. The point is not to force a decision in one day. The point is to make sure any gold-saving move still fits a clear budget, a steady plan, and a longer-term reason for buying.
Conclusion
Gold found support on 15 July 2026 after cooler US producer inflation data helped the market step back in. But the rebound still looked incomplete by the close because Treasury yields remained a pressure point and Middle East tensions stayed part of the wider backdrop. For Malaysian gold savers, the more useful takeaway is to read the move in both USD and Ringgit, understand the difference between global spot and local physical pricing, and stay with a saving plan that fits real cash flow. If a monthly gold budget is already in place, gradual buying still looks more sensible than trying to chase one daily move.

