


What happened to gold on 2 September 2026 was not a simple one-way move. Gold was still under pressure from a stronger US dollar, inflation worries and the US interest-rate story. But once weaker US private jobs data came out, buyers started to return. For Malaysian gold savers, the useful part is not just whether gold went up or down. It is understanding why the price moved, then reading that global price again in Ringgit and in your own saving budget.
- Introduction
- What Happened To Gold On 2 September 2026?
- What Is The Gold Chart Showing?
- Why Did Gold Move This Way?
- What Does This Mean For Gold Savers?
- Conclusion
What Happened To Gold On 2 September 2026?
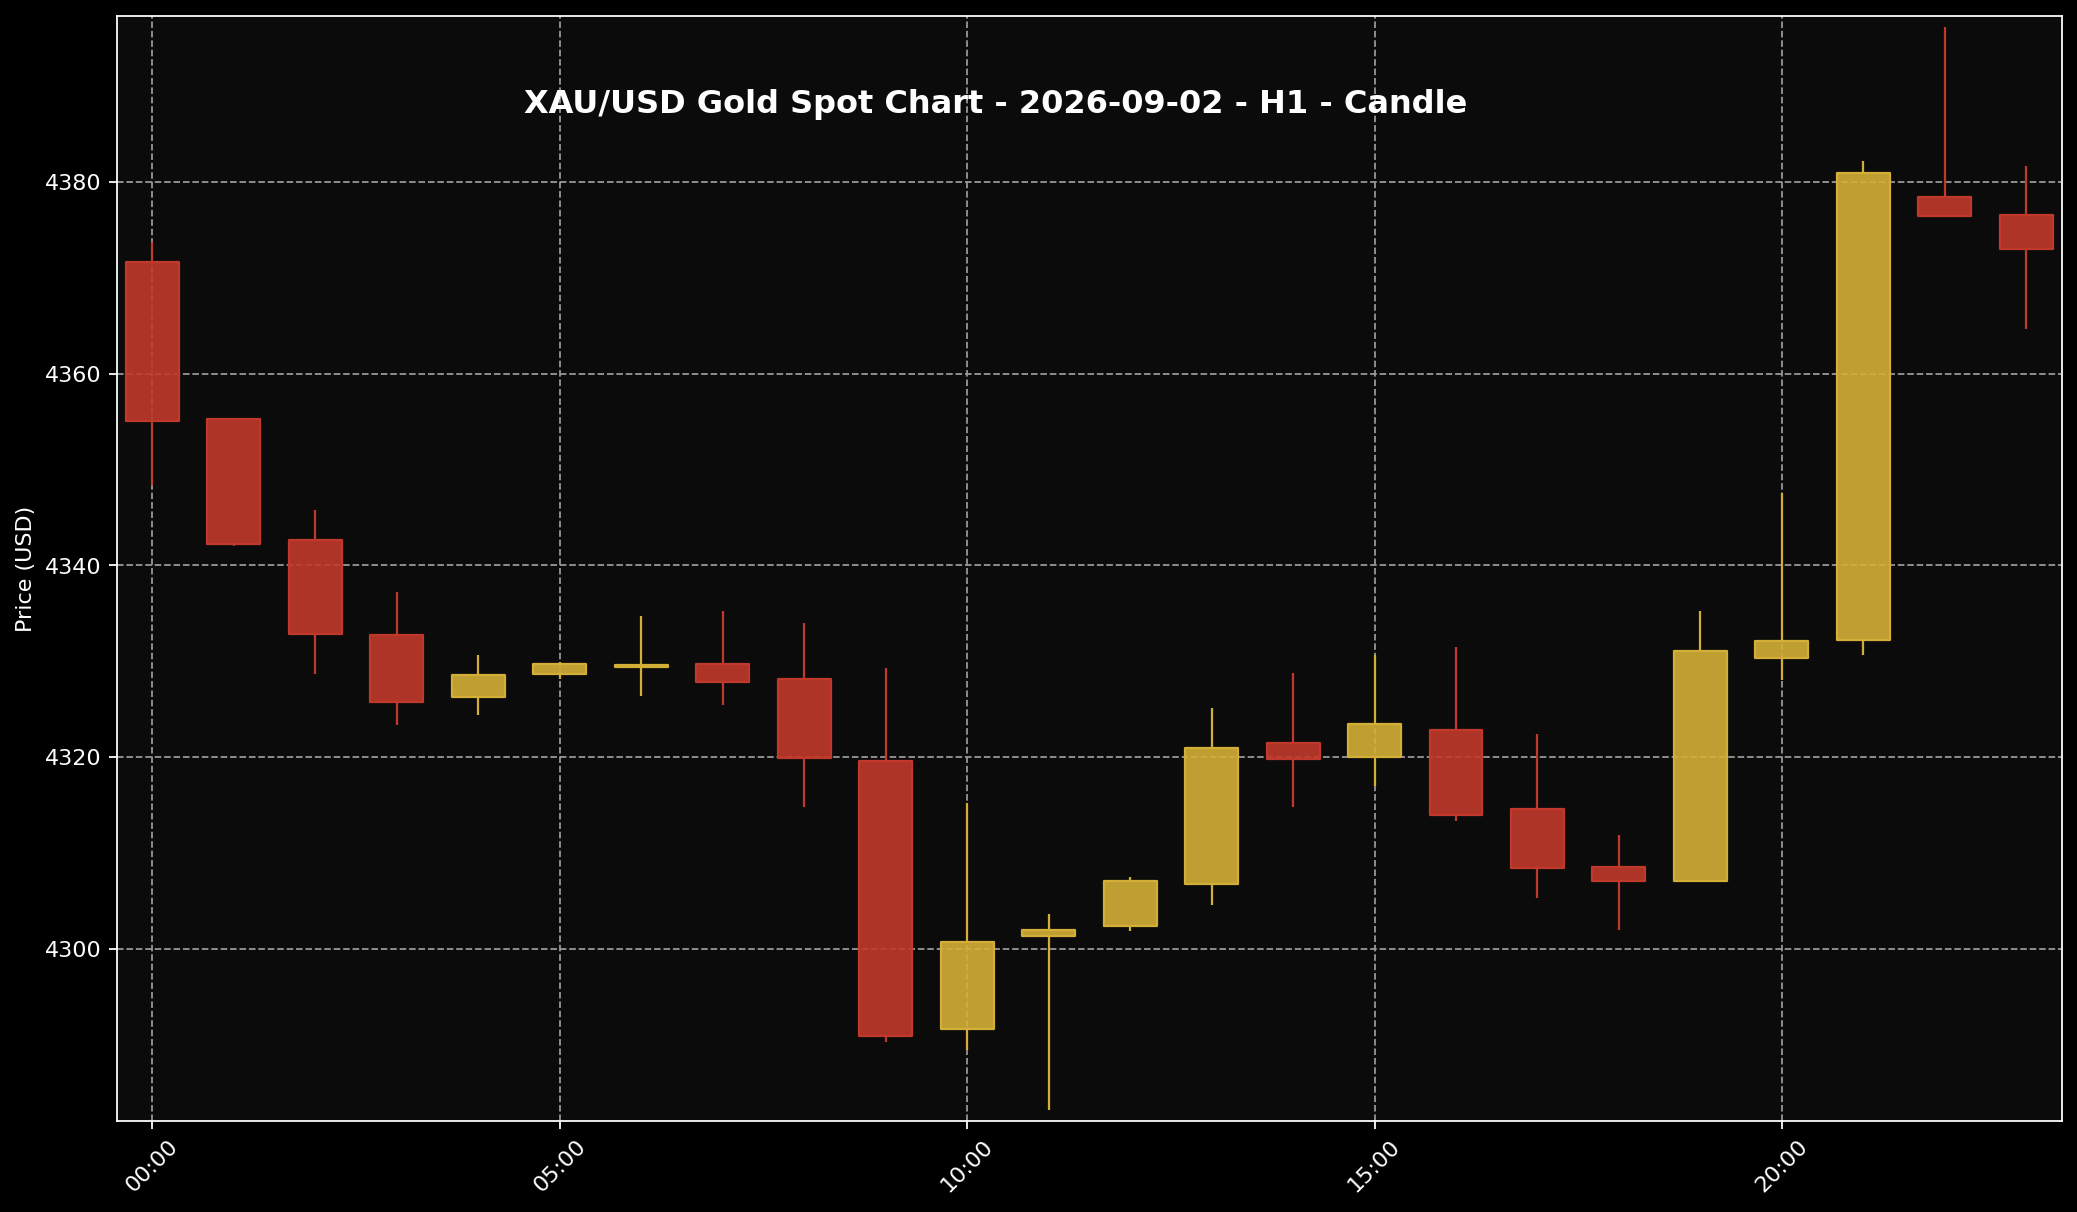 This chart shows the XAU/USD movement for the 2 September 2026 market session. Sifu Gold uses it as a visual reference, not a cue to buy emotionally.
1. At the approved snapshot around 11:00 PM Malaysia time, global spot gold through XAU/USD was around USD4,373 per troy ounce. Broken down into grams, that was about USD140.60 per gram. With USD/MYR around 4.04502 at the same snapshot, the global spot value was roughly RM17,689 per troy ounce, or about RM568.71 per gram. This is the global spot price converted into Ringgit. It is not the same as local physical retail gold prices in Malaysia.
2. The story that day had two sides. Gold was still feeling pressure because the US dollar remained firm and the market was still thinking about inflation risk and the direction of US interest rates. Since global gold is priced in US dollars, a stronger dollar can make gold more expensive for buyers using other currencies. That can slow short-term demand and make it harder for gold to climb.
3. But the day did not end with USD pressure alone. US ADP private jobs data came in weaker than expected. When jobs data looks slower, the market may start to think the Federal Reserve has less room to stay too aggressive on rates. That gave gold a chance to recover, even though the bigger pressure from the dollar, inflation worries and rate expectations had not fully disappeared.
What Is The Gold Chart Showing?
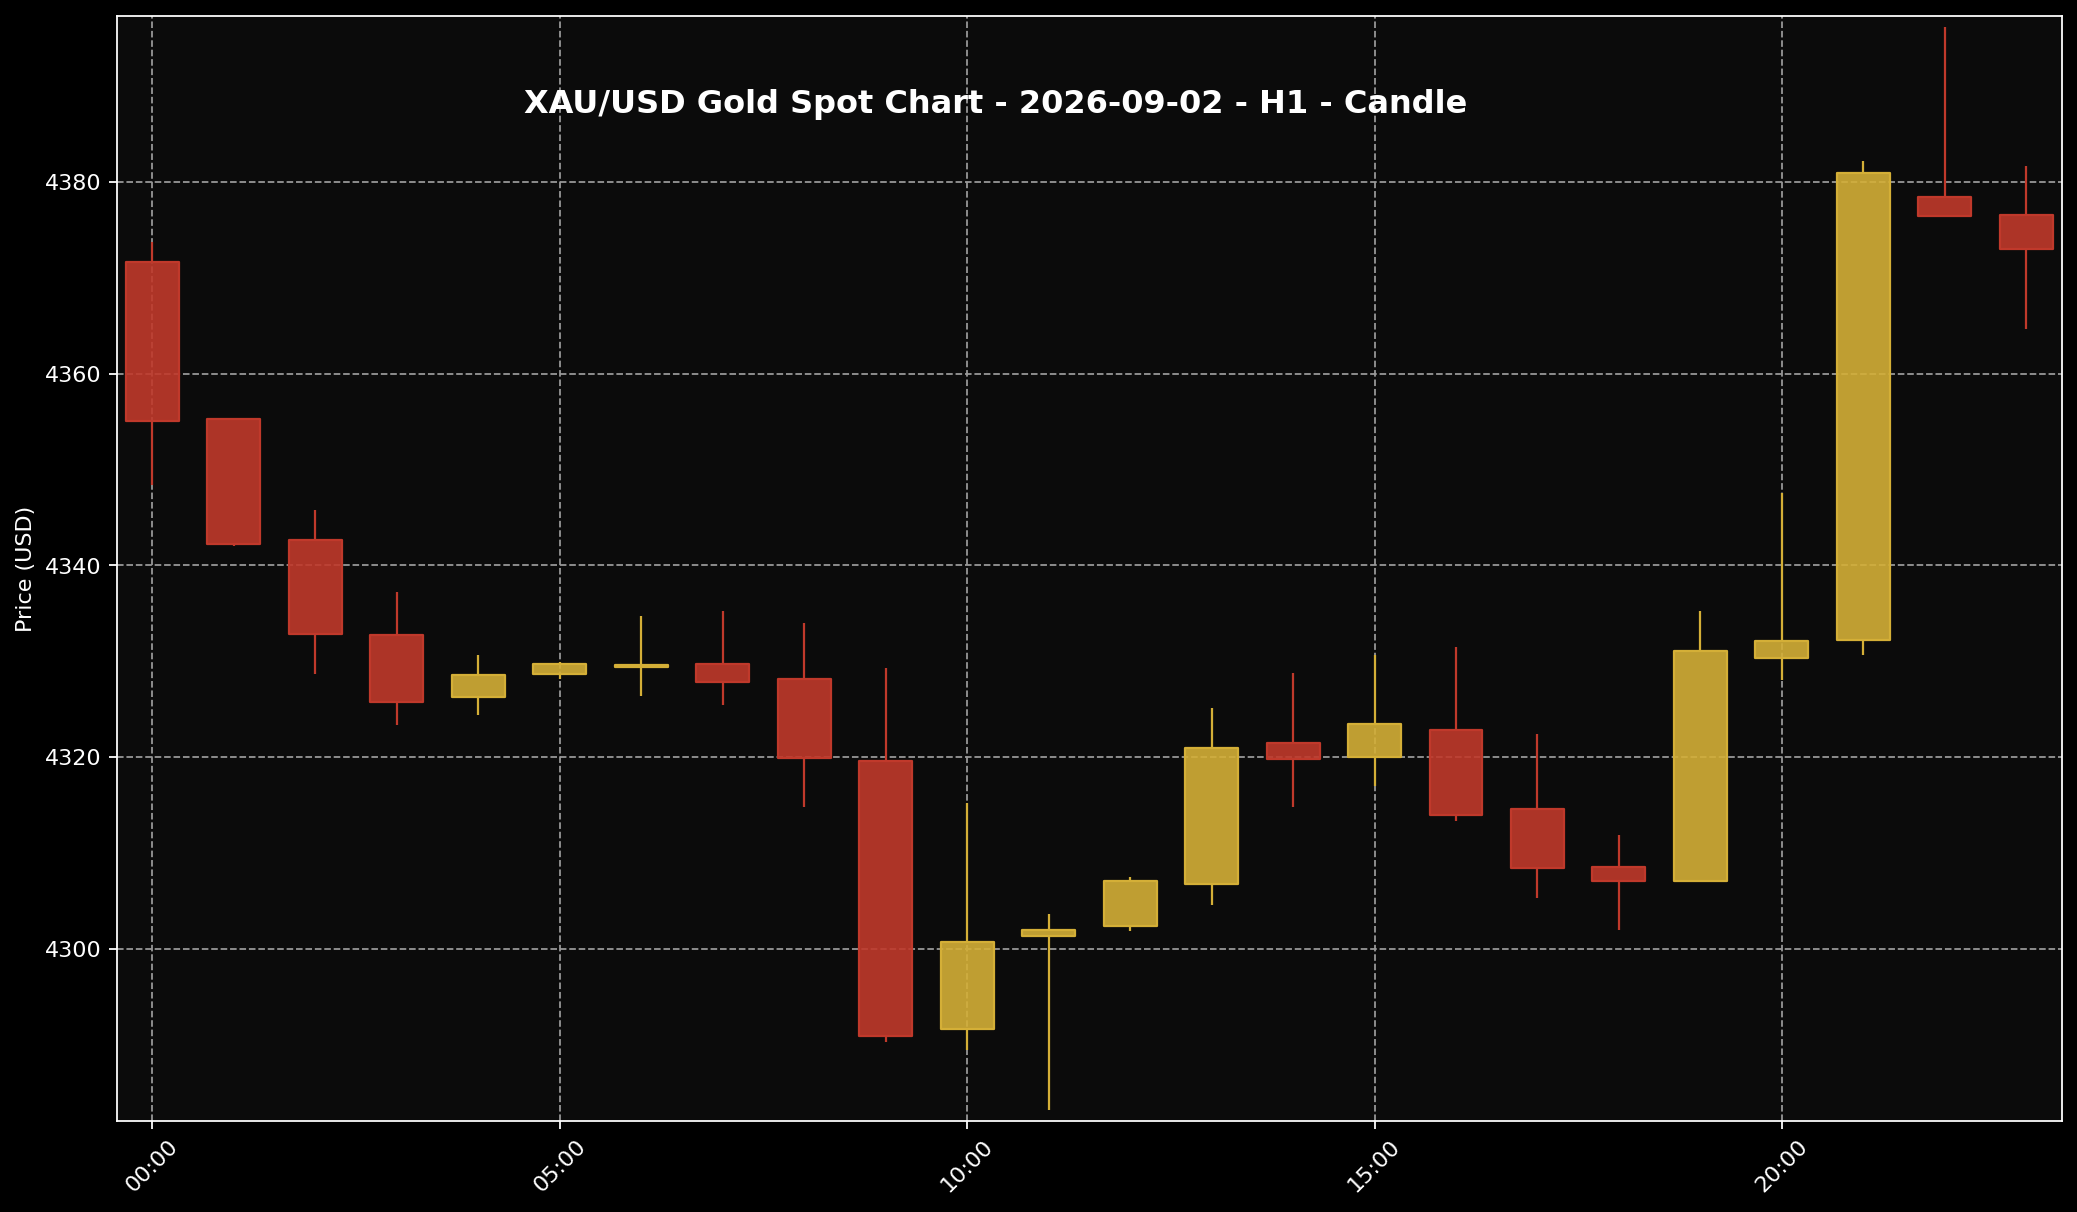 This chart helps readers see the gold price structure for the 2 September 2026 market session. It is used as market context and price-structure reference only.
1. Looking at the H1 chart for 2 September 2026, gold showed clear pressure earlier in the session. Price moved down from the USD4,370 area and at one stage traded closer to the lower USD4,290 to USD4,300 zone. In plain English, sellers were active earlier in the day. The market was not just drifting quietly; gold had to deal with real pressure before buyers came back in.
2. After that lower area formed, gold did not keep falling in a straight line. There was a rebound attempt. The chart showed buyers coming back and price moving again towards the upper USD4,370 to USD4,380 area. That tells us the market was still willing to buy gold at lower levels, but the rebound came after a fairly pressured move earlier in the session.
3. The final H1 candle in the approved snapshot closed around USD4,373. It traded between roughly USD4,365 and USD4,382, and closed slightly below where that candle opened. So the chart was not showing a clean, strong recovery. It looked more like gold was still trying to find its direction after a drop and rebound. This is only a market-structure reading, not an instruction to act on the chart.
Why Did Gold Move This Way?
 The US dollar is often one of the key factors influencing gold prices. When the dollar is firmer, gold can face more noticeable pressure.
1. The main reason was a mix of pressure and relief. First, the US dollar was still strong. Second, inflation worries were still in the background. Third, the market was still watching the Federal Reserve. The Fed is the US central bank. When traders think US rates may stay high for longer, gold usually finds it harder to build strong momentum because gold does not pay interest.
2. US Treasury yields also mattered. A yield is the return investors can get from holding US government bonds. When those returns look more attractive, some investors may choose bonds instead of gold for the short term. That can put pressure on gold, even if many people still see gold as useful for long-term saving and protection.
3. Then came the weaker ADP jobs data. This gave the market a reason to rethink part of the rate story. If the US jobs market looks less strong, traders may start to expect the Fed to be less aggressive later on. That helped gold try to recover. But because the US dollar, inflation risk and bond-yield pressure were still there, the rebound was not enough to change the whole story of the day.
What Does This Mean For Gold Savers?
 For Malaysian gold savers, the key point is to understand the gap between global spot price and local physical price, then act according to budget and discipline.
1. For me at Sifu Gold, daily gold movement is better treated as a checking point, not a reason to react emotionally. On 2 September 2026, gold was still high in Ringgit terms even though the global market was dealing with USD pressure and mixed US data. So for Malaysian gold savers, the better approach is to look at the full picture, not just one candle or one headline.
2. One thing should be clear. The global spot conversion of about RM568.71 per gram does not automatically mean that local physical gold will be priced at the same level. Physical gold prices can include USD/MYR movement, product premium, buy-sell spread, operating cost, logistics and local pricing structure. That is why XAU/USD should not be read exactly like a shop price in Malaysia.
3. In terms of action, if you already have a monthly budget set aside for gold, small and gradual buying can still fit your own saving plan. If your budget is tight, there is no need to force it. Split the budget, protect your commitments, do not commit the full budget at once, and keep your family’s basic cash flow safe. The goal is to build grams with discipline, not to guess the lowest price every day.
Conclusion
For 2 September 2026, gold was moving in a mixed story. The main pressure came from a strong US dollar, inflation risk and expectations around US interest rates. At the same time, weaker US jobs data helped gold attract buyers again. So the market had not found a clean new direction yet. For Malaysian gold savers, the more practical focus is to check the Ringgit translation, understand the difference between global spot gold and local physical pricing, and follow your own budget. If you want to start small, the Gold Accumulation Program by Public Gold allows gold saving to begin from as low as RM100. The key is to keep it planned, affordable and part of a long-term saving routine.

