


What happened to gold on 20 September 2026? The new trading week had only just reopened, so this Sunday reading was not the result of a full session. The fairest comparison remains Friday, 18 September, which was the last completed session. Gold reopened above the Friday reference, carrying some of that earlier rebound into the new week. But it was still too soon to call a fresh direction. For Malaysian gold savers, the useful part is understanding what supported Friday’s move and how that global price looks once USD/MYR enters the picture.
- Introduction
- What Happened To Gold On 20 September 2026?
- What Is The Gold Chart Showing?
- Why Did Gold Move This Way?
- What Does This Mean For Gold Savers?
- Conclusion
What Happened To Gold On 20 September 2026?
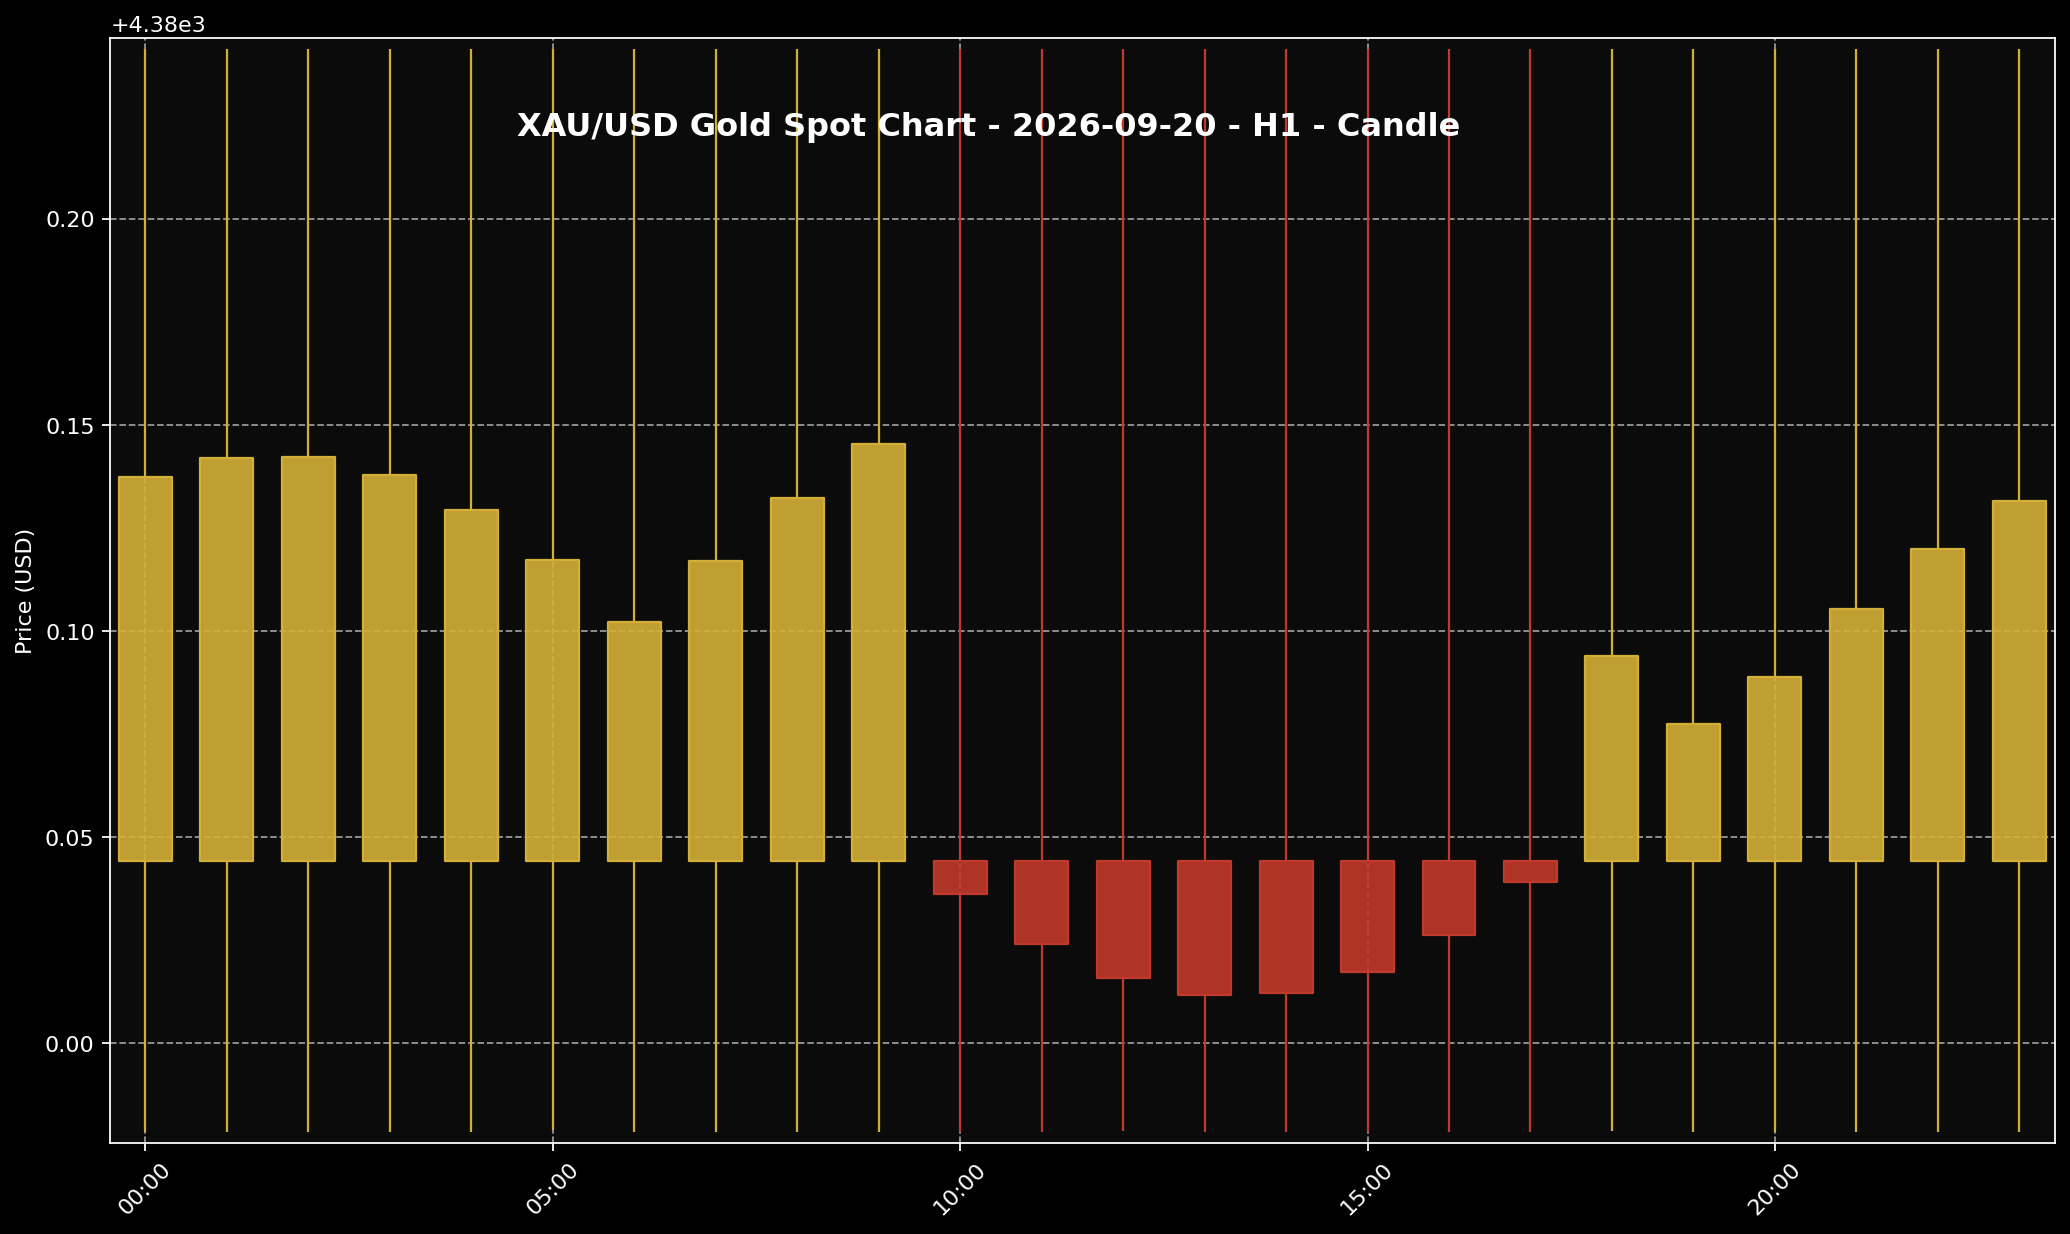 This chart shows the XAU/USD movement for the 18 September 2026 (historical reference; weekend market closed) market session. Sifu Gold uses it as a visual reference, not a cue to buy emotionally.
1. At around 11:00 PM Malaysia time, the early new-week reading placed global gold near USD4,380.13 per troy ounce, or about USD140.82 per gram. With USD/MYR around 4.08439, that converted to roughly RM17,890.17 per troy ounce or RM575.18 per gram. These Ringgit figures are global spot-price conversions. They are not local physical gold retail prices in Malaysia.
2. Because 20 September fell within the Sunday reopen window, the completed Friday session on 18 September remains the fairest reference point. At the same 11:00 PM Malaysia-time reference on Friday, gold was around USD4,355.50 per troy ounce. The early Sunday reading was therefore above Friday’s level, but it should not be treated like the close of a full new session.
3. Put simply, Friday’s rebound was still visible when the new week began. That is useful to know, but one early reopen reading cannot tell us whether gold has started a new upward move. The market had not been open long enough to build a complete picture. For now, this looks more like Friday’s momentum carrying over than confirmation of a fresh weekly direction.
What Is The Gold Chart Showing?
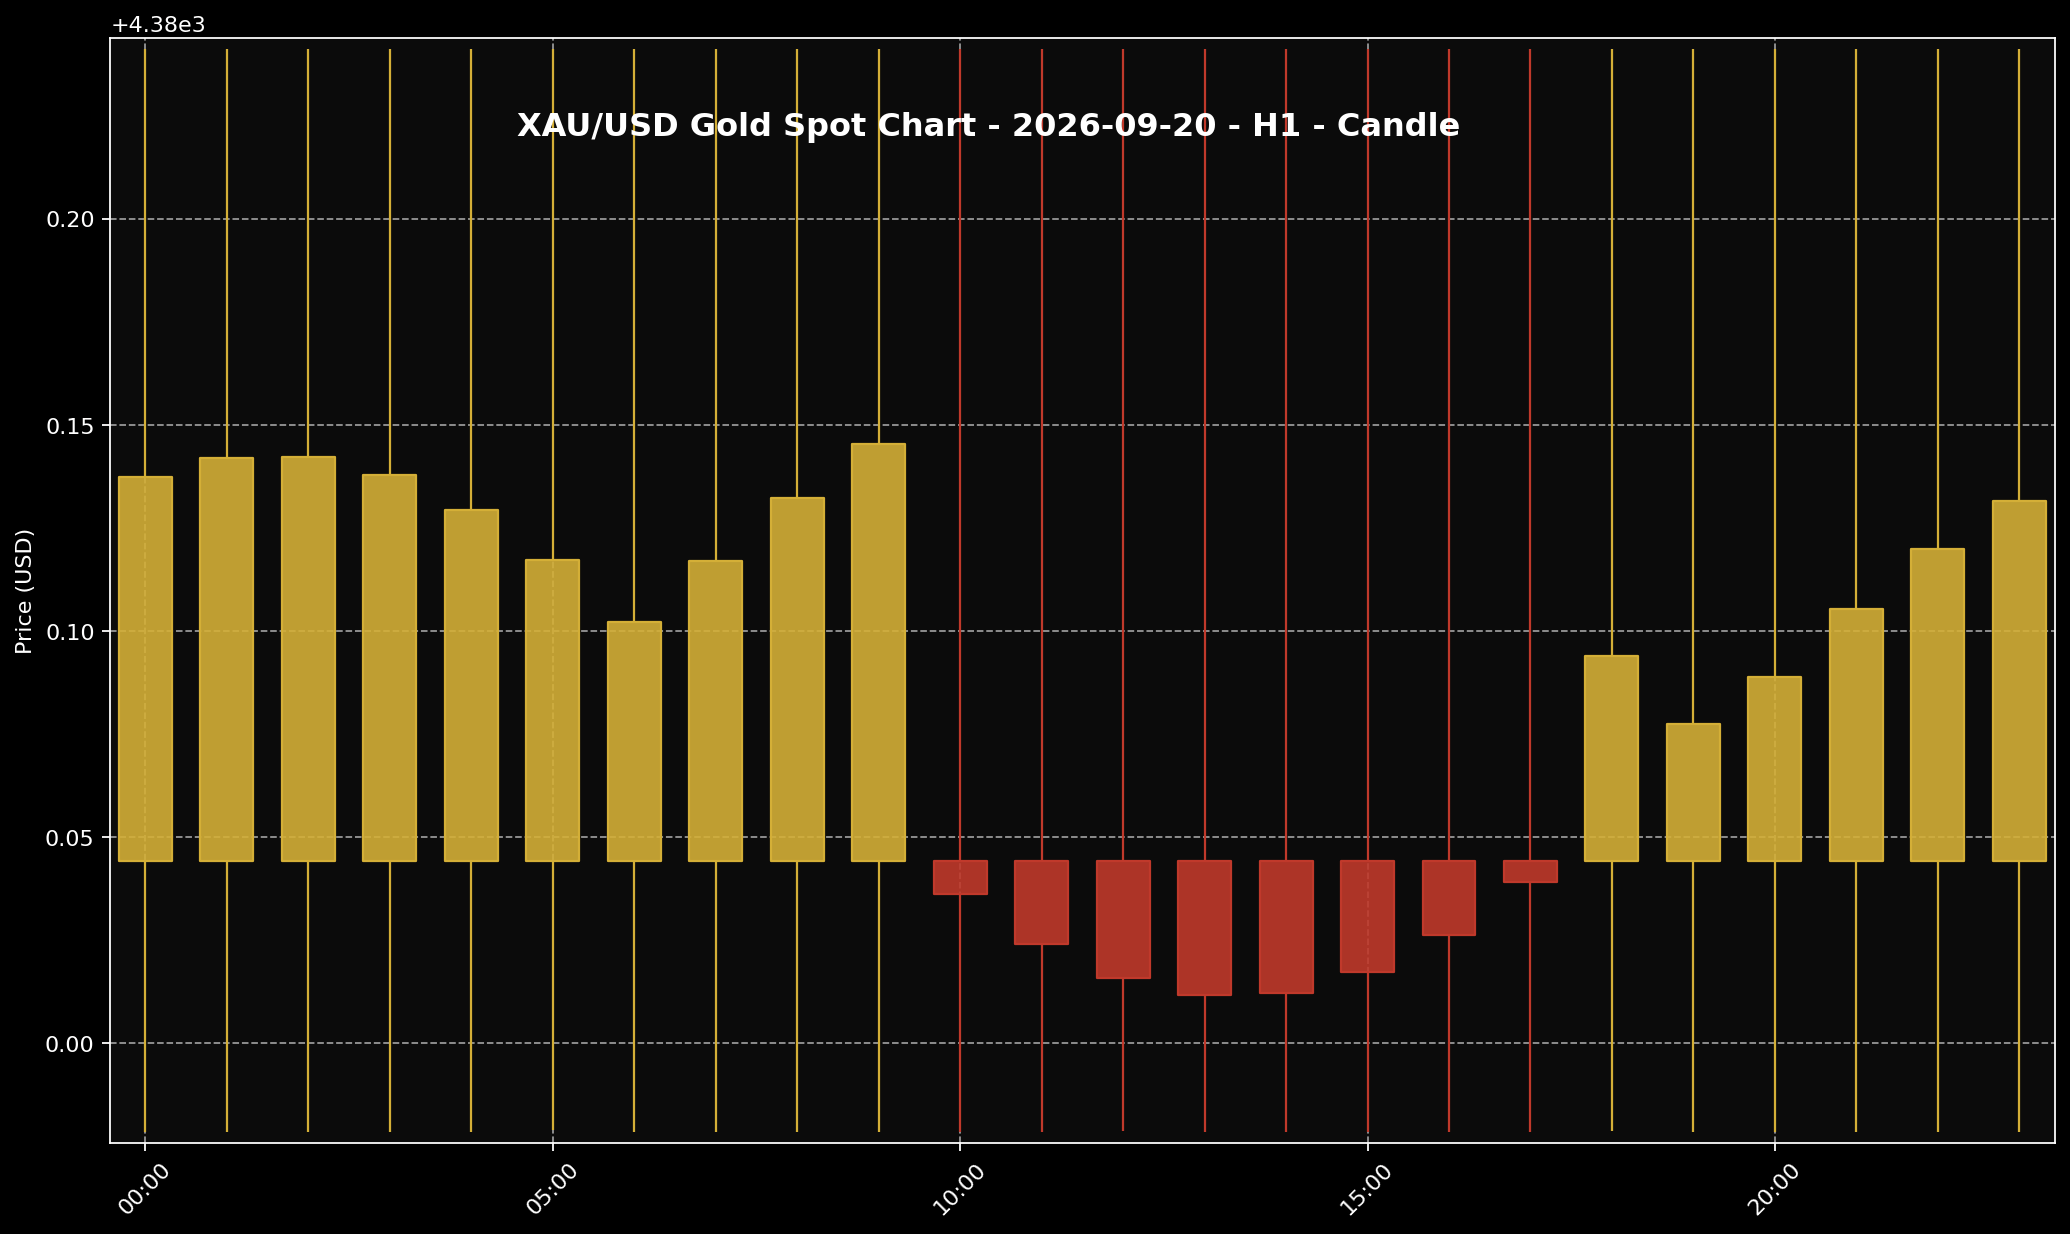 This chart helps readers see the gold price structure for the 18 September 2026 (historical reference; weekend market closed) market session. It is used as market context and price-structure reference only.
1. The H1 chart shows gold entering the new week above the Friday reference. An H1 chart groups price movement into one-hour blocks, so it helps us see how the market is behaving without turning every small move into a big conclusion. In this case, the chart supports a simple reading: Friday’s recovery had not disappeared at the reopen.
2. The Sunday chart had not yet had enough time to form a strong new pattern. We had not seen a full active session showing whether buyers could hold the higher price or whether the market was simply carrying over the final part of Friday’s move. That makes this a transition between two trading weeks rather than a completed new-week trend.
3. The next useful clue will come when fuller trading sessions get under way. If gold can hold its position while the US dollar and Treasury yields move, the weekly direction may become clearer. If the dollar and yields strengthen again, gold may find it harder to keep building momentum. At this stage, the chart gives us context, not a reason to chase the early move.
Why Did Gold Move This Way?
 The US dollar is often one of the key factors influencing gold prices. When the dollar is firmer, gold can face more noticeable pressure.
1. The bigger story carried over from Friday was the Federal Reserve’s interest-rate increase and its signal that further tightening could still follow. Higher interest rates can make US bonds more attractive because they offer a return. Gold does not pay interest, so it can struggle to build momentum when investors expect rates and bond yields to remain high.
2. Friday’s pressure eased when crude oil prices fell, Treasury yields moved lower earlier in the session and the US dollar became less forceful. That combination gave gold room to rebound, reach a one-week high and head towards a weekly gain. A softer dollar can make gold easier to buy for people using other currencies, while lower bond yields reduce some of the competition gold faces from interest-paying assets.
3. But Friday was not a one-way move. Treasury yields and the US dollar strengthened again later in the session, even though gold managed to hold its weekly gain. That is why the early Sunday reading looked positive without settling the bigger question. Friday’s rebound was still visible, but pressure from interest rates, the dollar and bond yields had not gone away. A fuller new-week session was still needed before drawing a stronger conclusion.
What Does This Mean For Gold Savers?
 For Malaysian gold savers, the key point is to understand the gap between global spot price and local physical price, then act according to budget and discipline.
1. For me at Sifu Gold, the higher early-week reading is something to watch, not something to chase. If you are saving gold for the long term, one Sunday reopen move does not need to change your whole plan. The last completed Friday session still gives us the more reliable comparison.
2. The RM575.18 per gram figure is a converted global spot reference. Local physical gold can be priced differently because USD/MYR, product premiums, buy-and-sell spreads, operating costs, logistics and current local pricing also matter. The number on the global chart will not always match the price you see when buying physical gold in Malaysia.
3. If you already have a monthly gold budget, small staged purchases can continue according to what you can comfortably afford. There is no need to commit the full budget at once because an early-week reading looks higher. If cash flow is tight or your emergency savings are not ready, waiting is also a disciplined decision. Household and family commitments still come first.
Conclusion
Gold started the new trading week above Friday’s reference, but the 20 September Sunday reopen was not a completed fresh session. The clearest story still comes from Friday, when lower crude oil prices, earlier relief in Treasury yields and a softer US dollar helped gold rebound after the Fed decision. Later strength in yields and the dollar showed that the wider pressure was still there. For gold savers, there is no need to rush after an early move. Watch how gold behaves once fuller sessions begin, keep local pricing and USD/MYR in view, and follow the budget you have already set. Building your gold savings in stages is usually more useful than trying to guess every short-term turn in the market.

