


What happened to gold on 22 September 2026? It climbed towards USD4,375 early in the session, then fell to around USD4,290 before recovering part of the drop later in the day. The main pressure came from hawkish Fed comments and growing expectations that US interest rates could stay higher for longer. That gave the US dollar more support and made it harder for gold to hold its early gains. For Malaysian gold savers, we also need to look at USD/MYR and the difference between global spot gold and local physical prices.
- Introduction
- What Happened To Gold On 22 September 2026?
- What Is The Gold Chart Showing?
- Why Did Gold Move This Way?
- What Does This Mean For Gold Savers?
- Conclusion
What Happened To Gold On 22 September 2026?
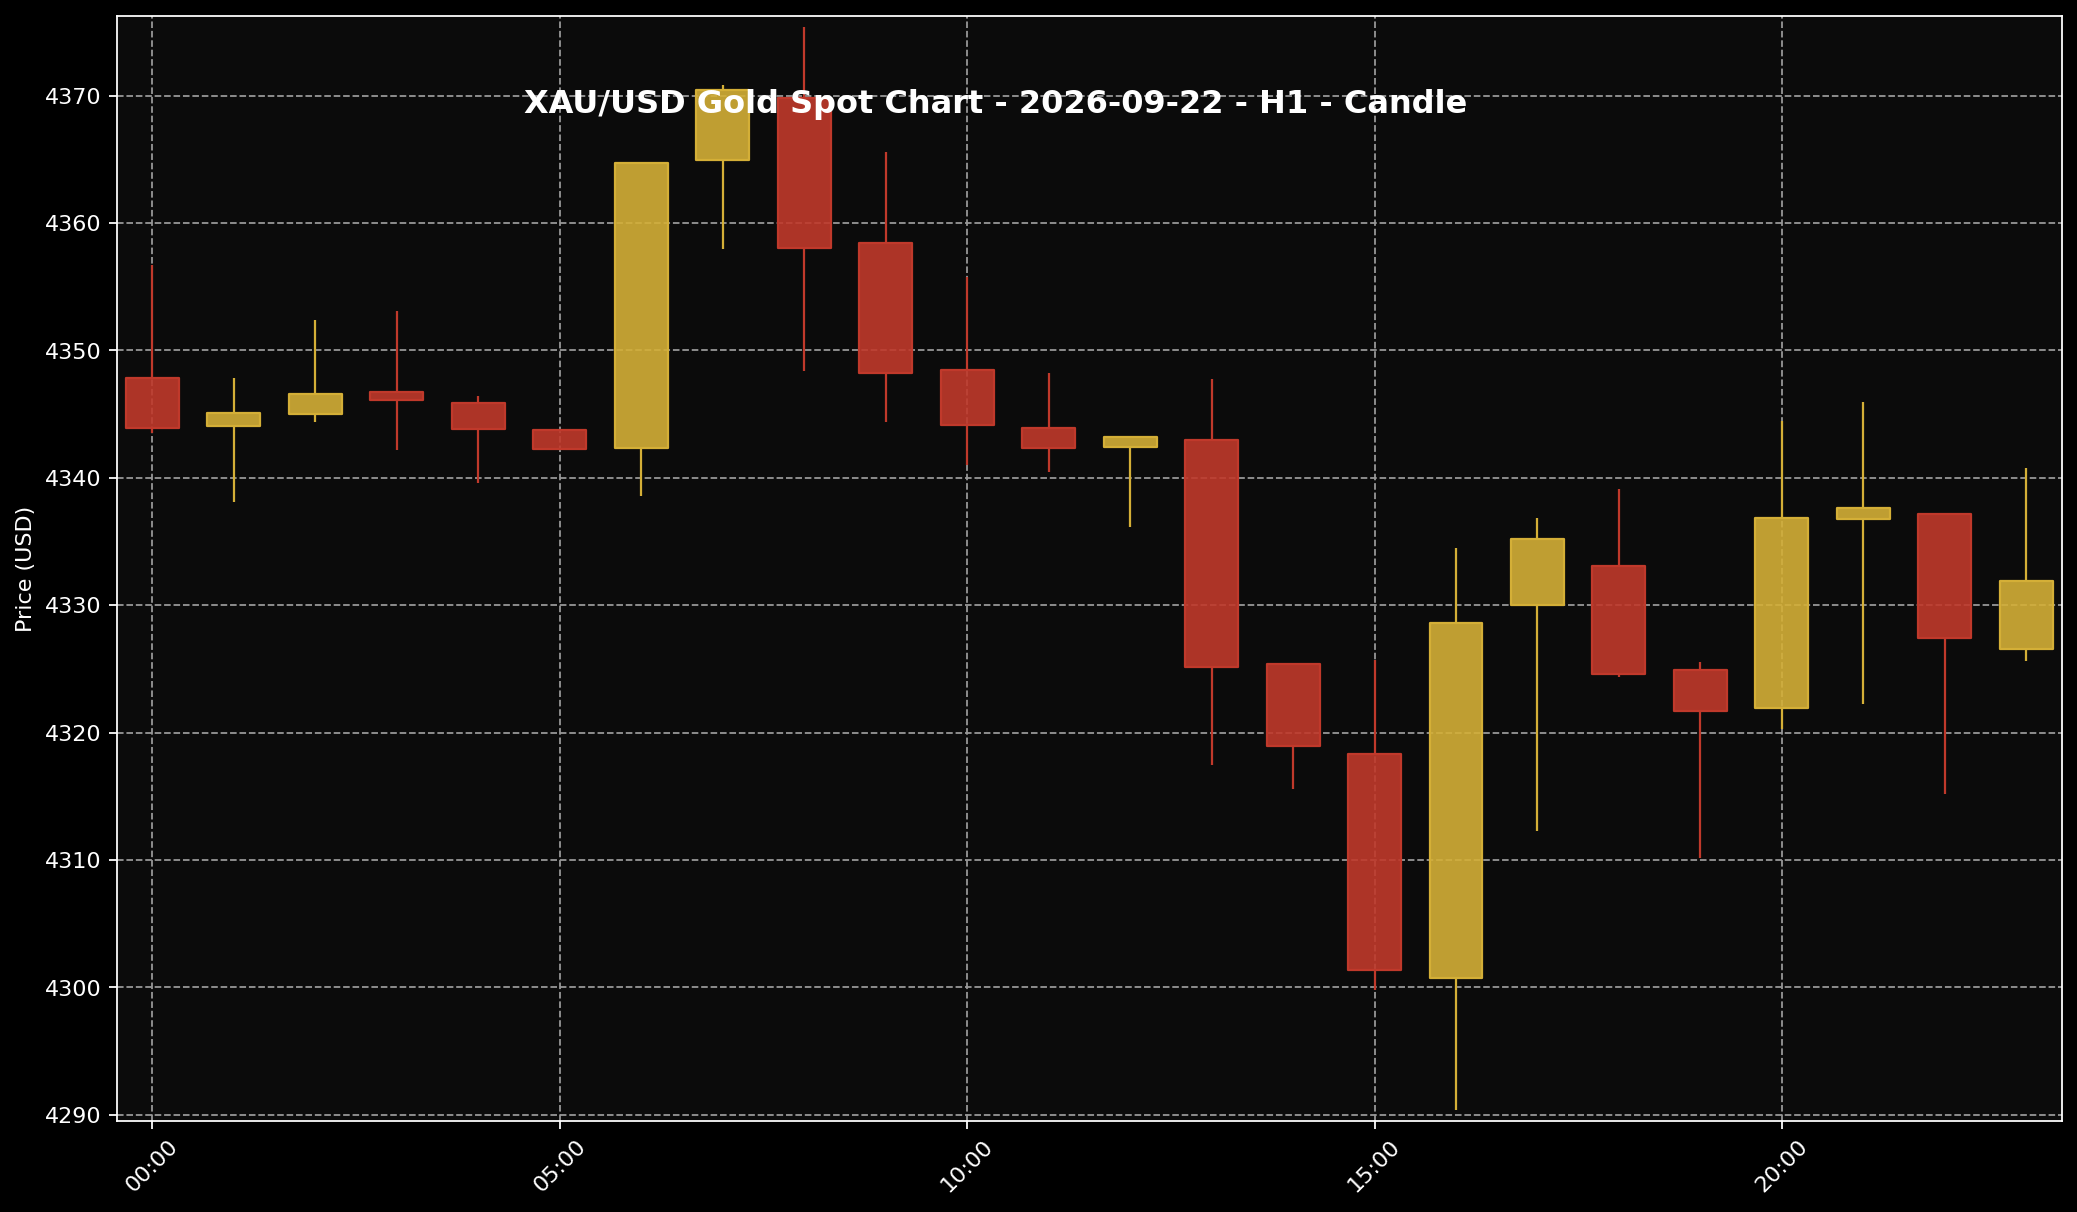 This chart shows the XAU/USD movement for the 22 September 2026 market session. Sifu Gold uses it as a visual reference, not a cue to buy emotionally.
1. Gold started near USD4,340 and climbed towards USD4,375 early in the session. That rise did not last. The price then fell to around USD4,290 before buyers returned and helped it recover part of the drop.
2. At the 11 pm Malaysia-time snapshot, gold stood at around USD4,331.86 per troy ounce, or USD139.27 per gram. With USD/MYR near 4.07468, that worked out to roughly RM17,650.96 per troy ounce or RM567.49 per gram.
3. These Ringgit figures are global spot conversions, not local physical gold prices in Malaysia. So the picture was quite clear: gold recovered from its intraday low, but it did not make it back to the early-session high.
What Is The Gold Chart Showing?
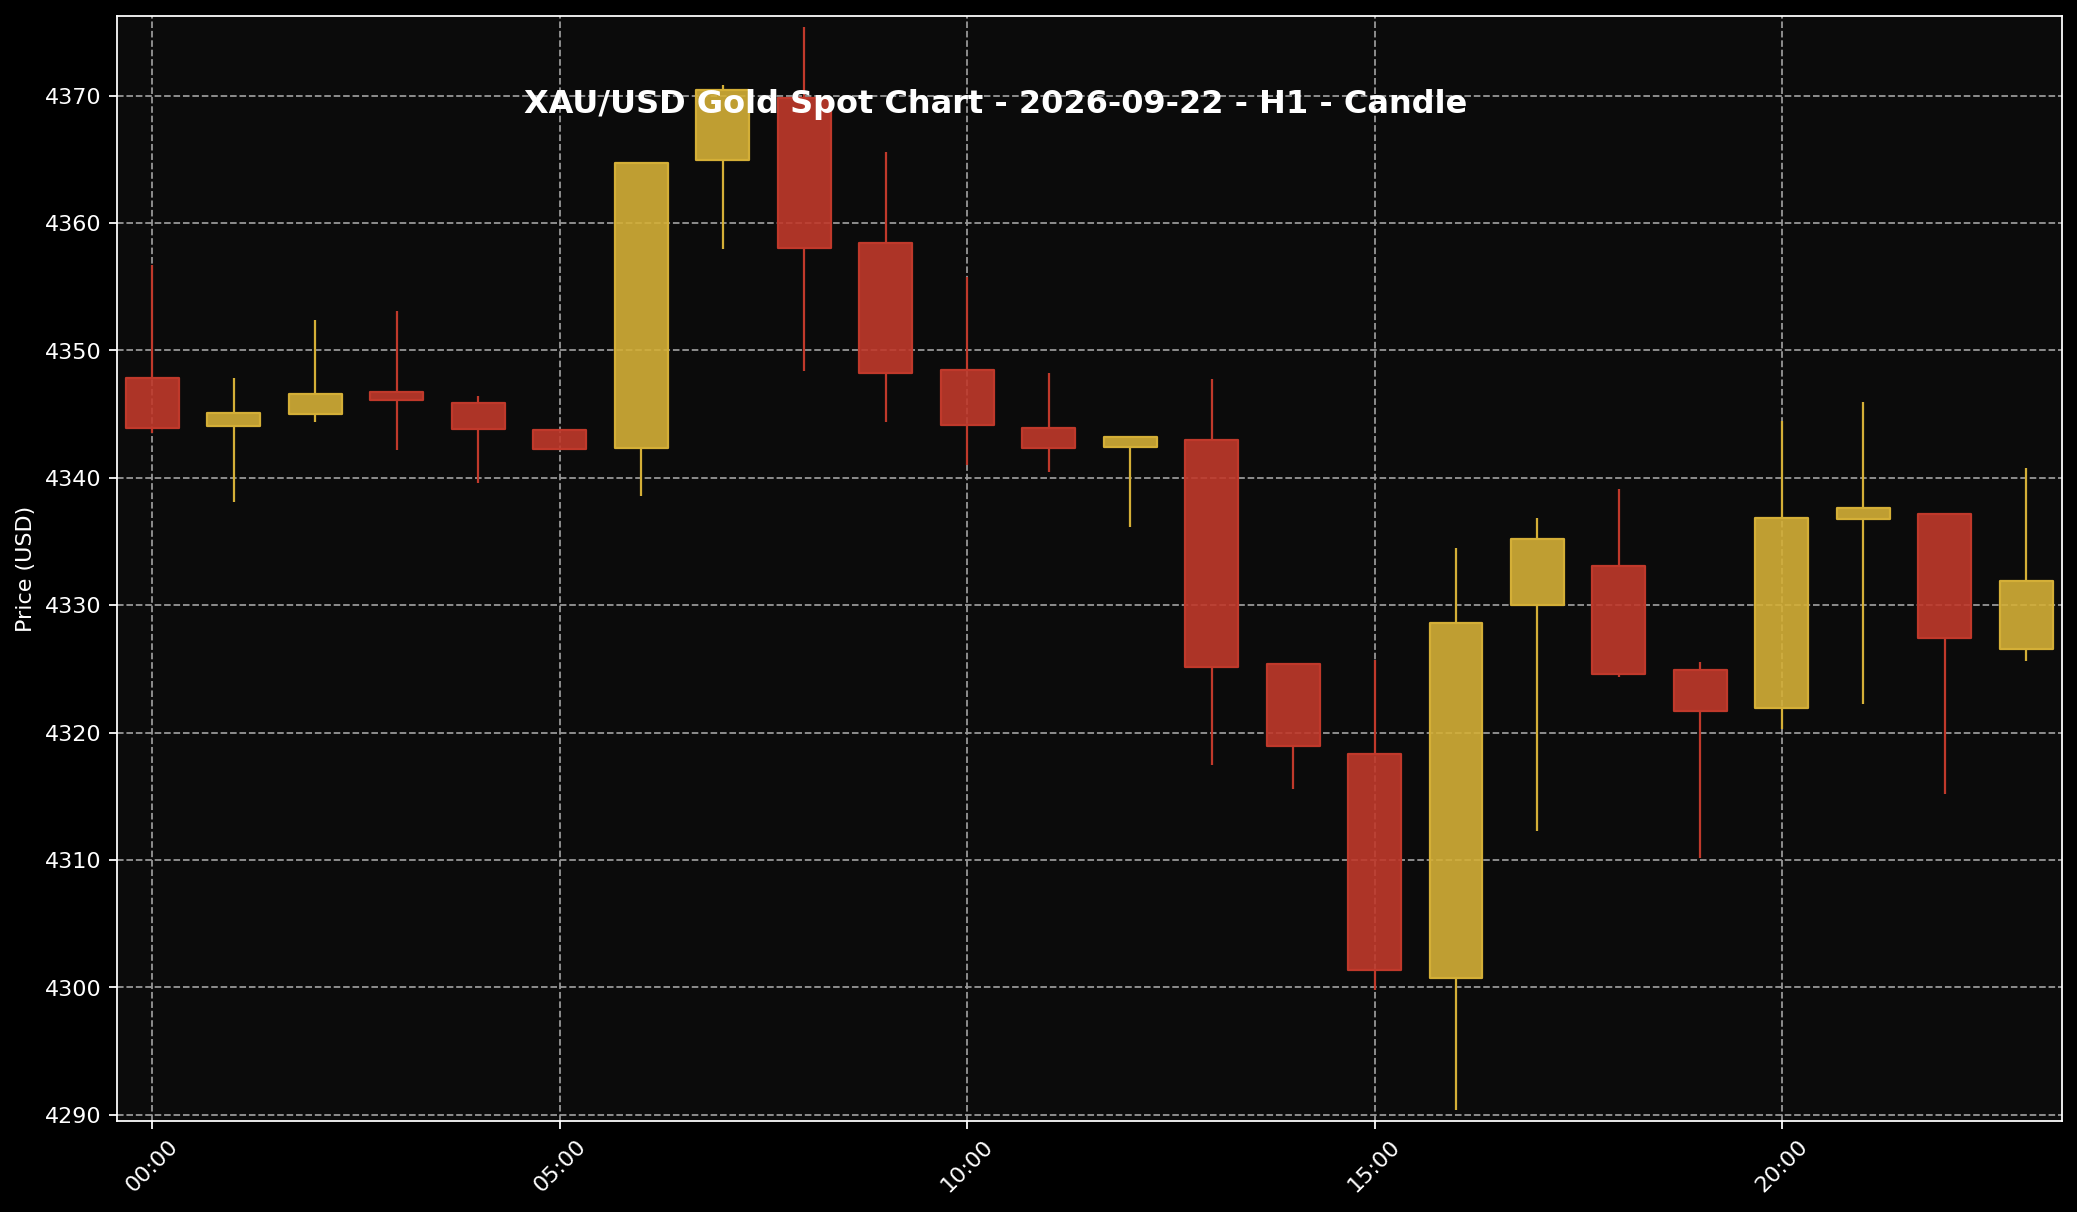 This chart helps readers see the gold price structure for the 22 September 2026 market session. It is used as market context and price-structure reference only.
1. Looking at the one-hour chart, buyers tried to push gold higher during the morning. But once the price reached the USD4,370 to USD4,375 area, that early momentum started to fade.
2. The selling that followed pulled gold down by almost USD85 from the session high. Buyers appeared again near USD4,290 and pushed the price back towards USD4,330.
3. That recovery tells us there was still demand when the price dropped. It was not strong enough to erase the full decline, though. This chart simply explains how gold moved on 22 September 2026; it is not a signal to buy or sell.
Why Did Gold Move This Way?
 The US dollar is often one of the key factors influencing gold prices. When the dollar is firmer, gold can face more noticeable pressure.
1. The story began with Fed officials leaving the door open to higher rates or keeping them high for longer. The market started adjusting its expectations, and gold came under pressure as that view gained ground.
2. Put simply, assets that pay interest can look more attractive when rates are expected to stay high. Gold does not pay interest. Higher rate expectations can also support the US dollar, making gold more expensive for buyers using other currencies.
3. Oil prices and US Treasury yields also moved during the session, but not in one clear direction throughout the day. They were supporting parts of the story rather than driving it. The clearest pressure still came from the Fed, the higher-for-longer rate outlook and a firmer US dollar.
What Does This Mean For Gold Savers?
 For Malaysian gold savers, the key point is to understand the gap between global spot price and local physical price, then act according to budget and discipline.
1. For Malaysian gold savers, a day like this is more useful as a reminder to review the market than as a reason to react quickly. The drop towards USD4,290 and the recovery that followed show how much gold can move within a single day.
2. The global spot price is also not the same as the physical gold price paid in Malaysia. USD/MYR, product premiums, buying and selling spreads, operating costs and local pricing structures all play a part. That is why RM567.49 per gram should not be treated as a local retail price.
3. If you already have a separate budget for gold savings, small staged purchases can be considered as part of your own plan. Do not commit the full budget at once or disturb emergency funds and family commitments. If cash flow is tight, waiting and reviewing the budget first is also a sensible choice.
Conclusion
Gold came under pressure on 22 September 2026 as the market placed more weight on US interest rates staying higher for longer. The price recovered from around USD4,290 to USD4,331.86, but it remained below the early-session high. For Malaysian gold savers, the better focus is still the budget, the difference between spot and physical prices, and building gold holdings gradually rather than chasing every daily move.

