


What happened to gold on 23 September 2026? It climbed towards USD4,370 early in the day, but that strength did not last. Stronger-than-expected US PMI data gave traders another reason to think the Fed might keep policy tighter, or even raise rates again. The dollar strengthened, Treasury yields rose, and gold fell below USD4,300. For Malaysian gold savers, the story is not only about that drop. We also need to look at USD/MYR and the difference between global spot gold and the local physical price.
- Introduction
- What Happened To Gold On 23 September 2026?
- What Is The Gold Chart Showing?
- Why Did Gold Move This Way?
- What Does This Mean For Gold Savers?
- Conclusion
What Happened To Gold On 23 September 2026?
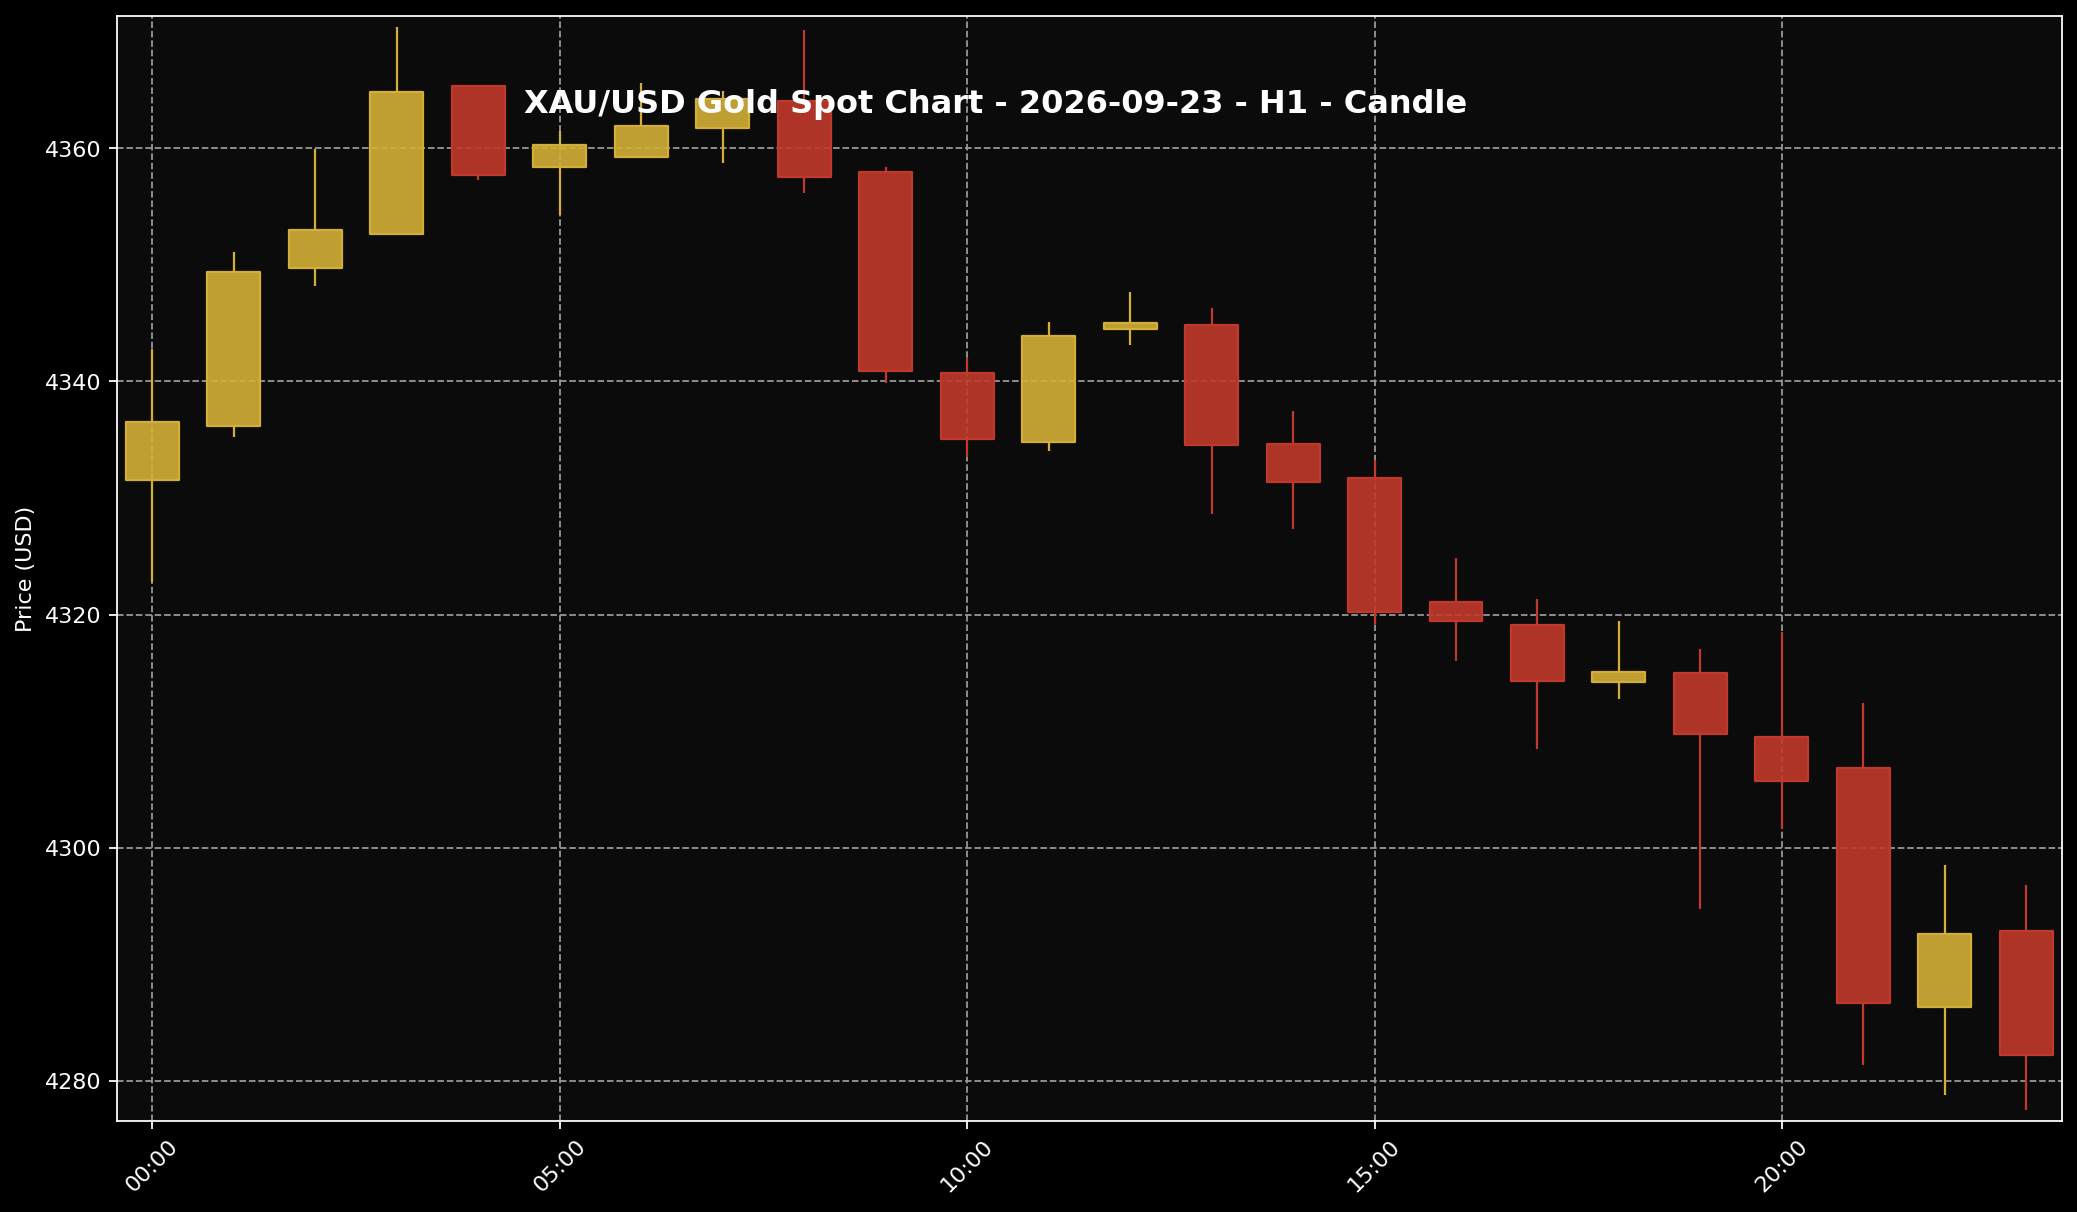 This chart shows the XAU/USD movement for the 23 September 2026 market session. Sifu Gold uses it as a visual reference, not a cue to buy emotionally.
1. Gold started the day on a stronger note and briefly traded near USD4,370.44/oz. But the rise did not hold. As the session moved on, the price slipped into lower areas and eventually fell below USD4,300.
2. At 11:00 pm Malaysia time, gold stood near USD4,282.25/oz, or about USD137.68/g. With USD/MYR around 4.07916, that worked out to roughly RM17,467.98/oz or RM561.61/g.
3. Those Ringgit figures are global spot conversions, not local physical gold prices in Malaysia. Even so, they give us a clear picture of how the pressure on gold continued towards the end of the day’s review period.
What Is The Gold Chart Showing?
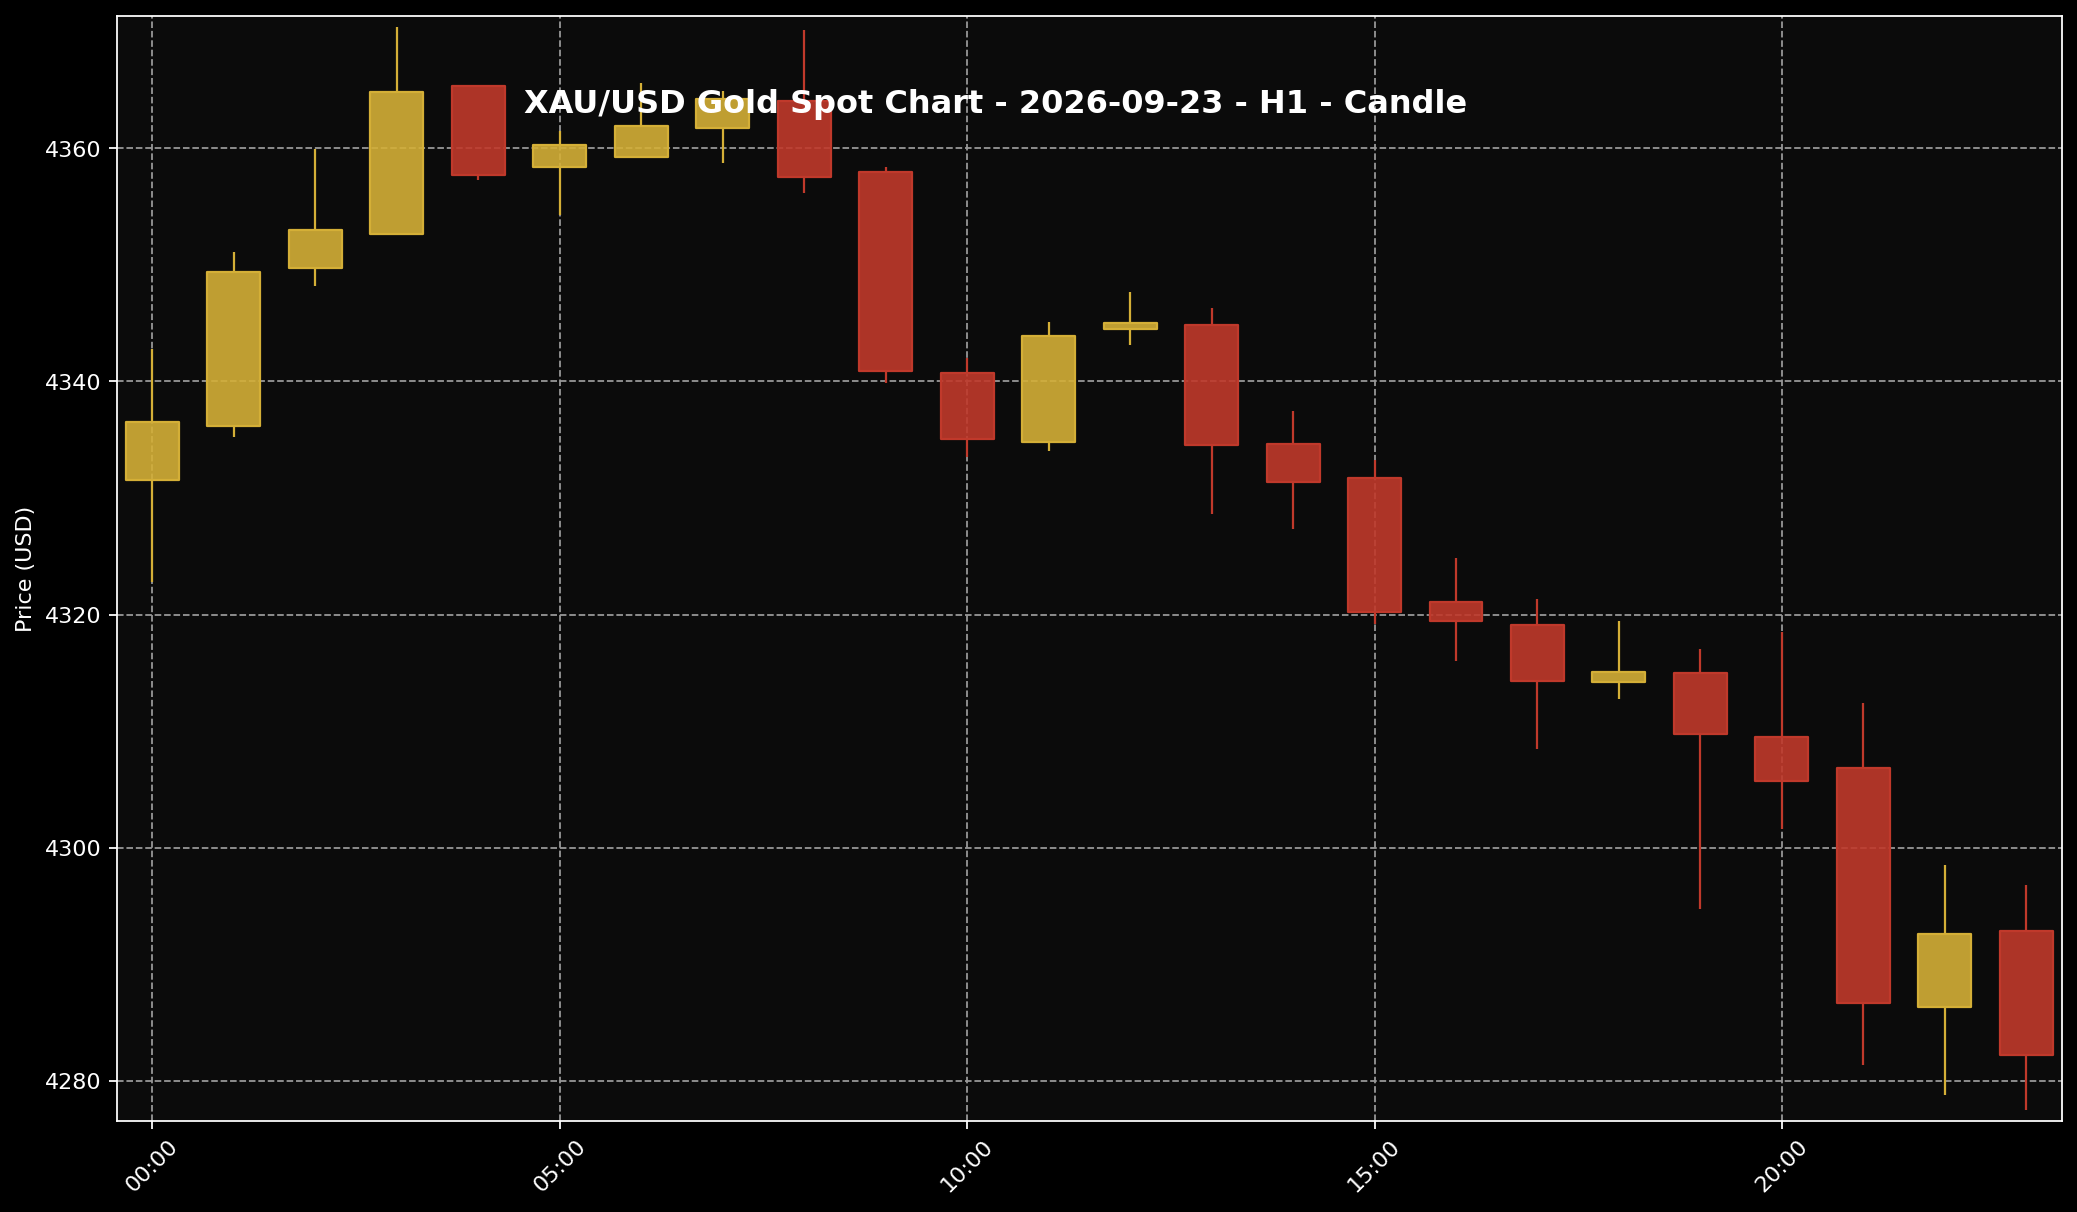 This chart helps readers see the gold price structure for the 23 September 2026 market session. It is used as market context and price-structure reference only.
1. If we look at the one-hour chart, the pattern is quite clear. Gold moved higher early on, lost momentum and then worked its way down. Each rebound also became shorter as the day progressed.
2. USD4,300 was a widely watched round-number area. Once gold moved below it, sellers still appeared to have the stronger influence during that session. This is simply a reading of the price structure, not a level for making an immediate buying or selling decision.
3. Gold did try to bounce, with the 10:00 pm candle closing near USD4,292.57. An hour later, however, it was back near USD4,282.25. Put simply, that rebound was not strong enough to carry gold back towards its earlier price area.
Why Did Gold Move This Way?
 The US dollar is often one of the key factors influencing gold prices. When the dollar is firmer, gold can face more noticeable pressure.
1. The story starts with US interest-rate expectations. Comments from the Fed had already encouraged the market to think that policy could stay tighter, with rates remaining high or possibly rising again.
2. Stronger-than-expected US PMI data then added to that view. The figures suggested that the US economy could still cope with high interest rates. Treasury yields rose, and the US dollar strengthened as traders adjusted their expectations.
3. The key point is simple. When bonds offer more attractive returns, gold usually finds it harder to build momentum because it does not pay interest. A stronger dollar adds more pressure because global gold is priced in dollars. So this was one connected chain: stronger US data changed the rate outlook, the dollar and yields moved higher, and gold fell.
What Does This Mean For Gold Savers?
 For Malaysian gold savers, the key point is to understand the gap between global spot price and local physical price, then act according to budget and discipline.
1. For Malaysian gold savers, a daily drop like this is better used as a reason to review the market, not react emotionally. The move on 23 September showed that gold was still sensitive to US rates, the dollar and Treasury yields.
2. The RM561.61/g figure should not be treated as the price of physical gold at a shop or on a savings platform. Local prices also reflect USD/MYR, product premiums, buying and selling spreads, operating costs and each seller’s pricing structure.
3. If you already have a monthly gold-saving budget, staged purchases can continue according to your original plan. There is no need to guess the lowest price or commit the full budget at once. If cash flow is tight, protect your household commitments and emergency fund first. Waiting while you review the budget is also a disciplined choice.
Conclusion
Gold fell below USD4,300 on 23 September 2026 after stronger US economic data brought tighter Fed policy expectations back into focus. The dollar and Treasury yields moved higher, while the chart showed selling pressure continuing through the 11:00 pm Malaysia-time snapshot. For gold savers, one day’s move should not be viewed on its own. Look at USD/MYR, the local physical price, the spread and your own budget as well. A clear long-term plan and staged buying, when affordable, matter more than trying to catch the lowest point.

