


What happened to gold on 25 July 2026? The main story was not a strong rally or a sharp fall. Gold was still holding above the wider USD4,000 area, but the market did not yet have a strong reason to push much higher. For Malaysian gold savers, the useful point is this: gold still had support, but pressure from the Fed rate story, US Treasury yields and resilient US data had not gone away.
- Introduction
- What Happened To Gold On 25 July 2026?
- What Is The Gold Chart Showing?
- Why Did Gold Move This Way?
- What Does This Mean For Malaysian Gold Savers?
- What Practical Action Makes More Sense?
- Conclusion
What Happened To Gold On 25 July 2026?
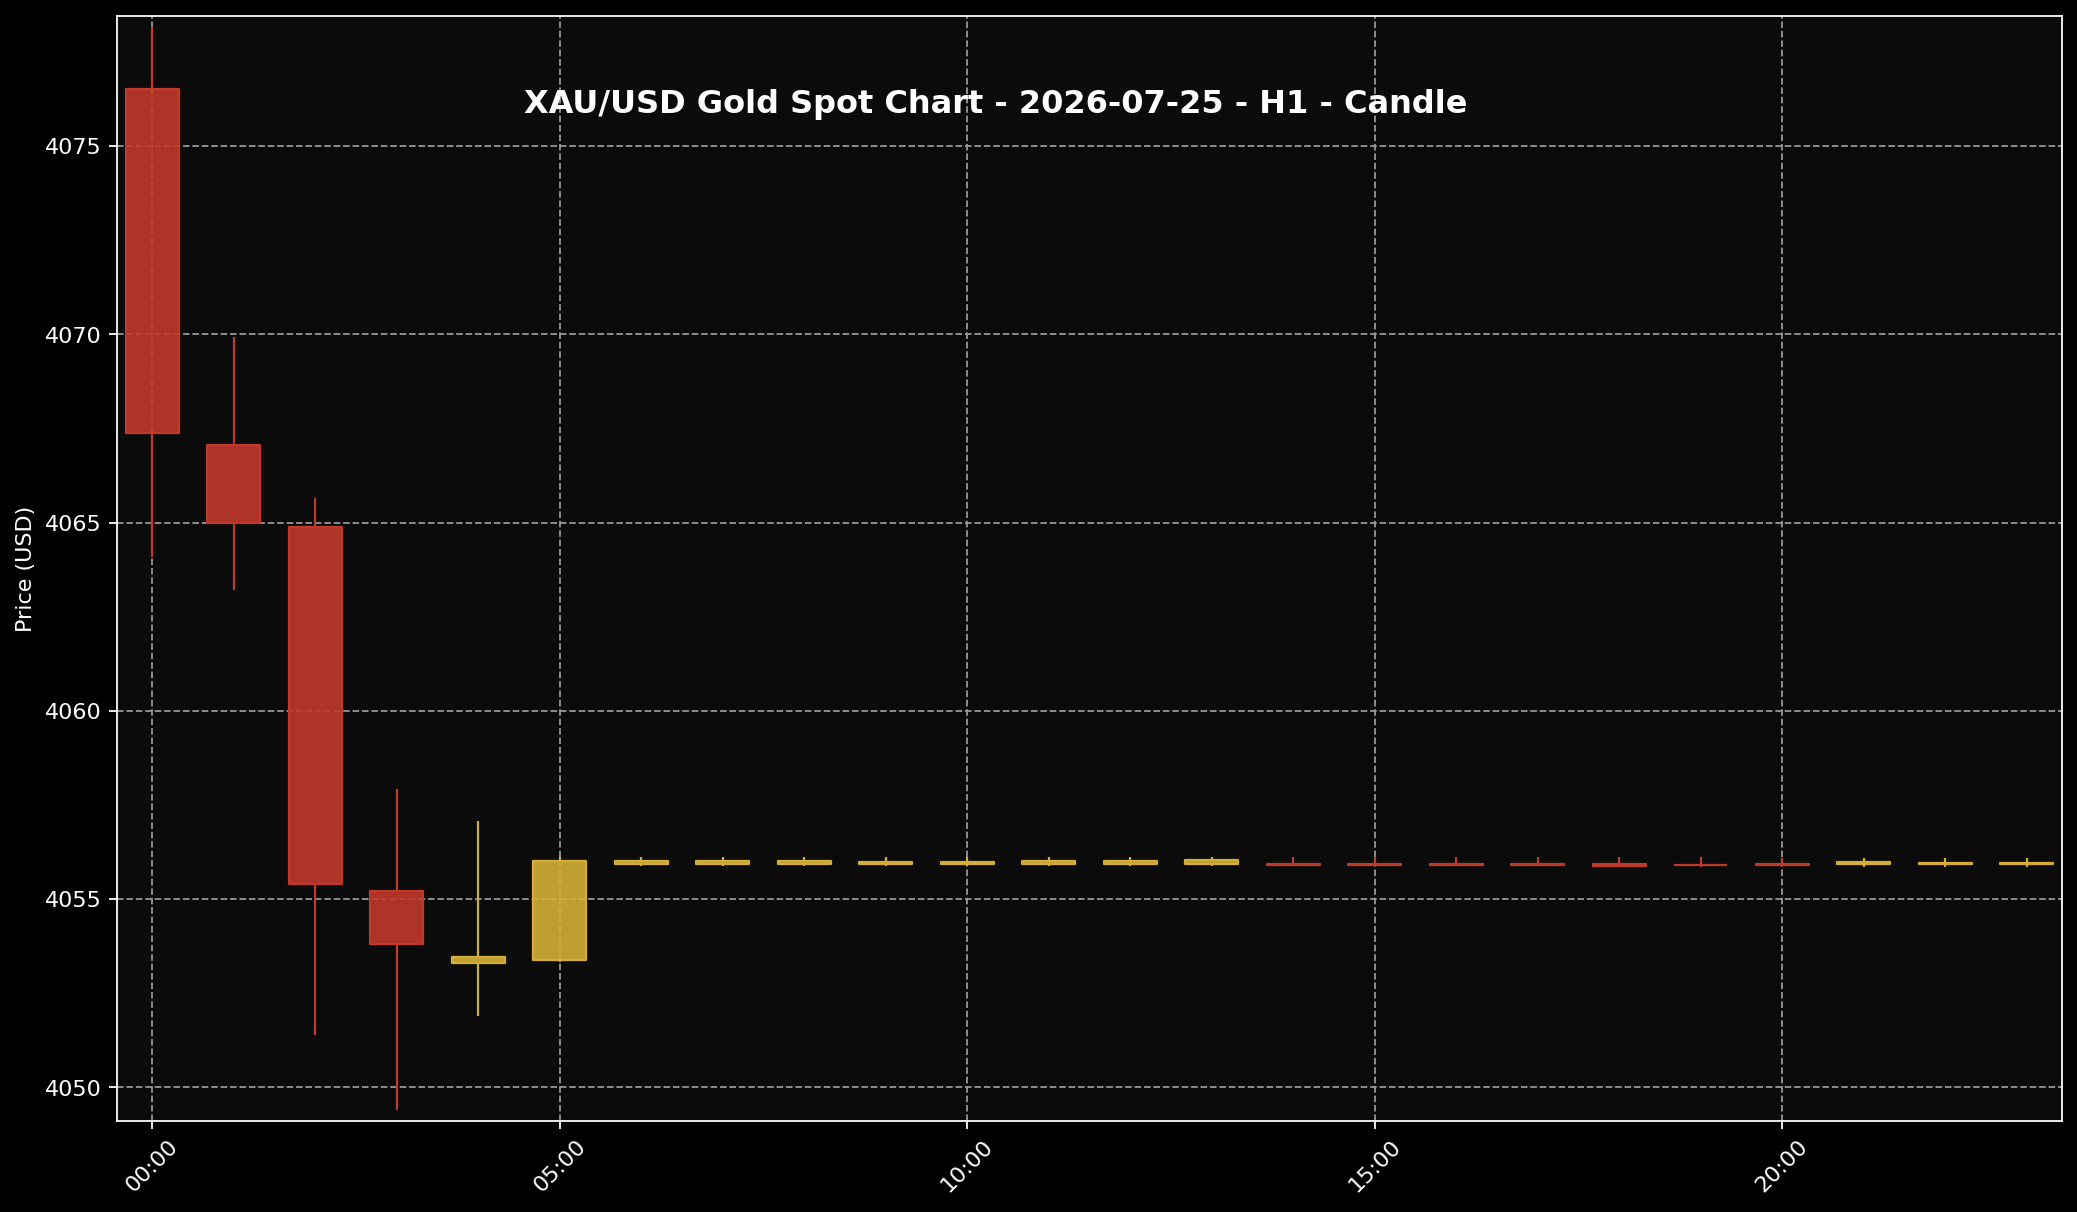 This chart shows the XAU/USD movement for the 25 July 2026 market session. Sifu Gold uses it as a visual reference, not a cue to buy emotionally.
1. At the price reference around 11:00 PM Malaysia time, XAU/USD was around USD4,055.95 per troy ounce. In gram terms, that is roughly USD130.40 per gram. Using the USD/MYR reference of about 4.09098, the same global spot price works out to around RM16,592.83 per troy ounce, or about RM533.47 per gram.
2. That Ringgit conversion matters for Malaysian readers, but the difference must be clear. This is the global spot gold price translated into Ringgit. It is not the same as local physical retail gold in Malaysia, and it is not the exact price for jewellery, bars, coins or any specific physical gold product. Local physical prices can include spread, premium, product type, operating cost and local pricing structure.
3. If we look at the bigger story, gold was still holding at a high level. It was not breaking down through the wider USD4,000 area. But it also did not look strong enough to run much further. Kitco’s gold coverage pointed to the same idea: gold was still holding above USD4,000, while Fed-rate risk, firm US yields and resilient US data continued to limit the upside.
What Is The Gold Chart Showing?
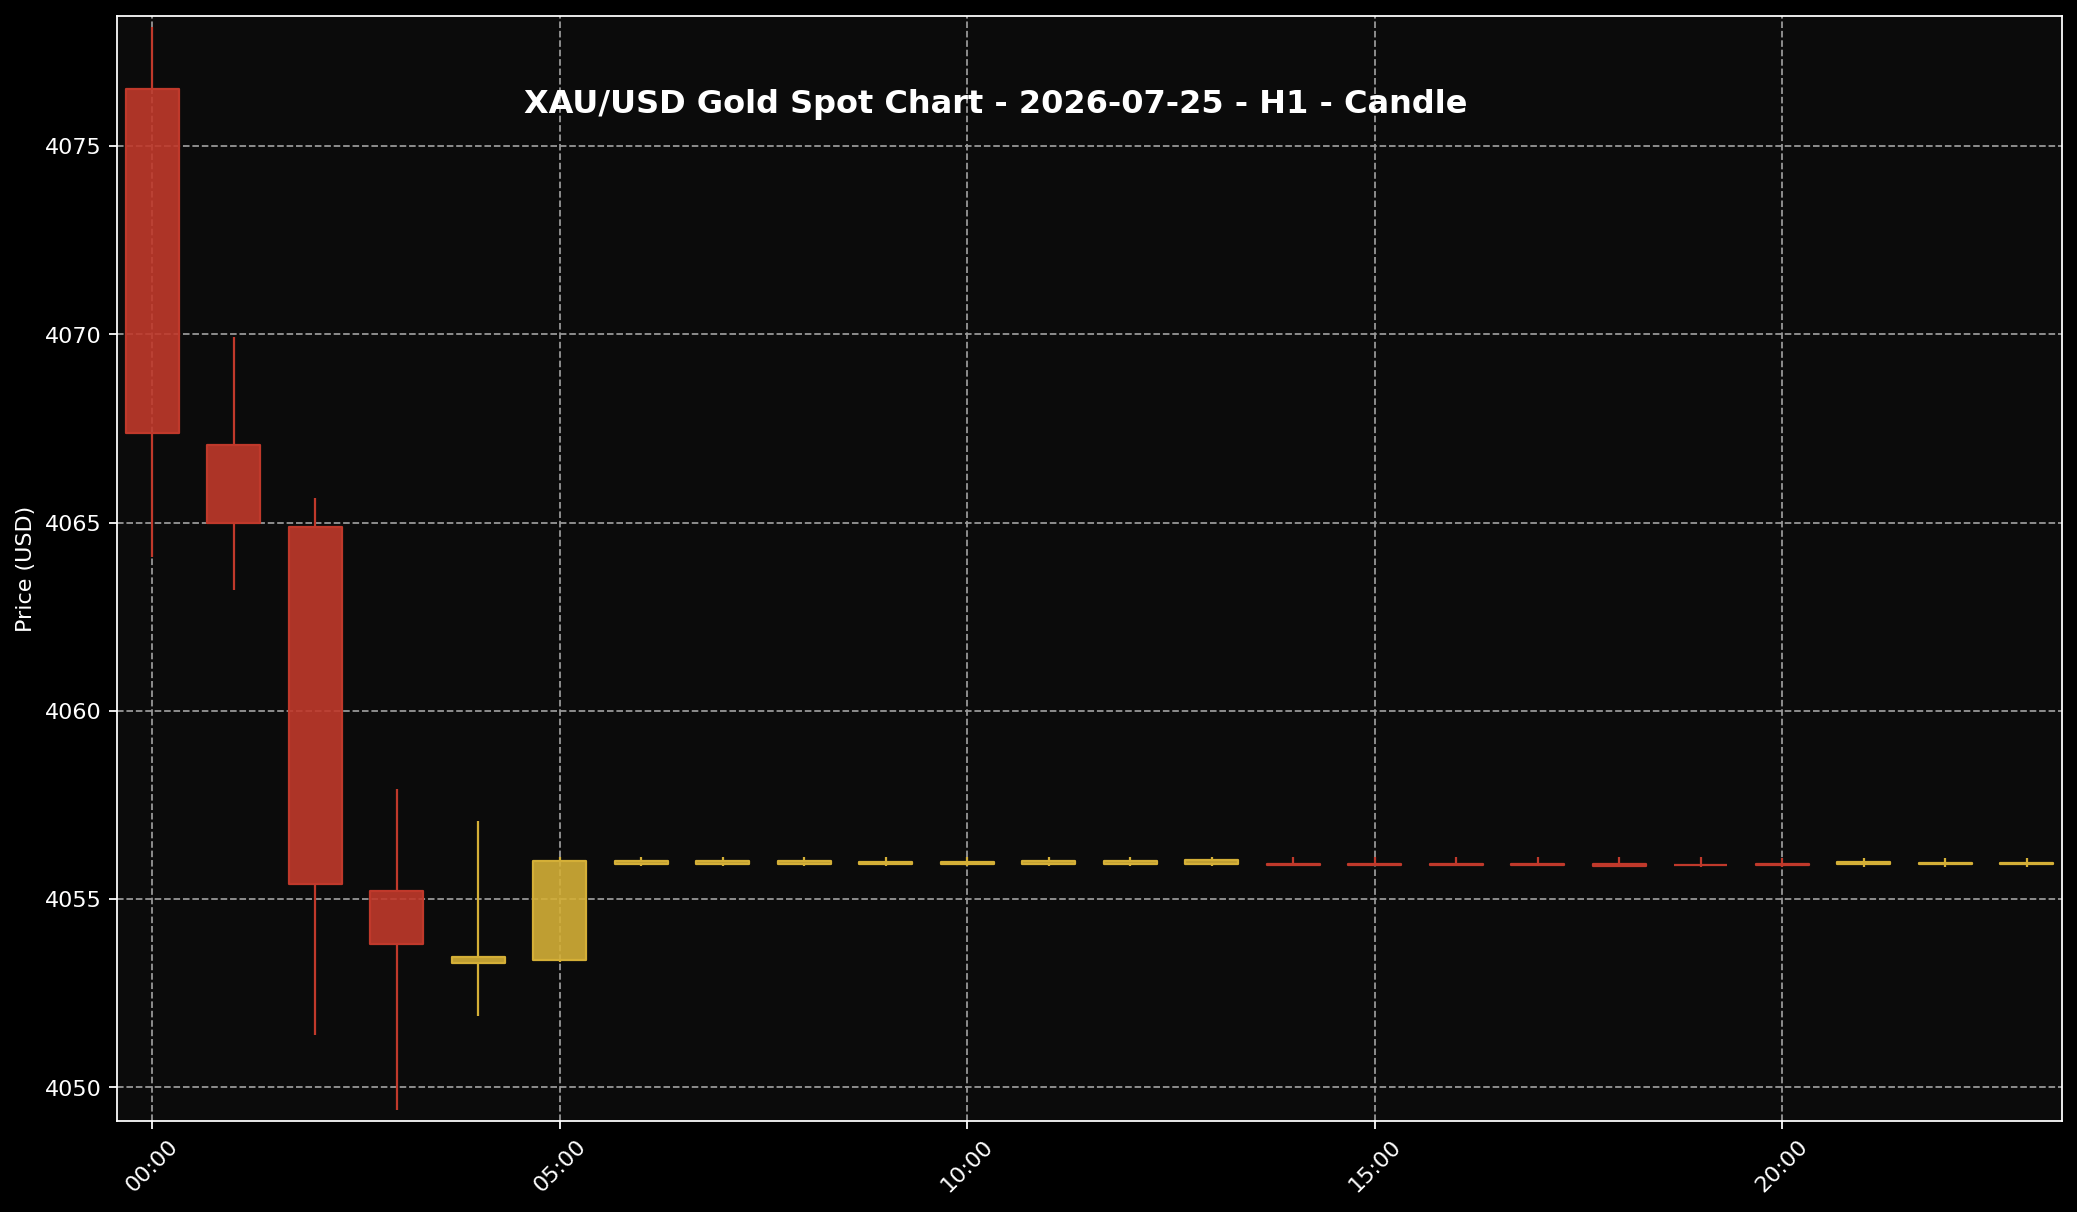 This chart helps readers see the gold price structure for the 25 July 2026 market session. It is used as market context and price-structure reference only.
1. The H1 XAU/USD chart showed gold losing some ground earlier on the chart. Several red candles pulled the price down from around the USD4,075 area towards the USD4,055 area. After that, the movement became much flatter, with smaller candles sitting close to the USD4,056 zone.
2. Put simply, the chart was not showing a fresh, strong direction. Gold had come down from the earlier level, then settled into a tighter range. When candles become smaller and the price stays close in one area, it usually means the market is waiting for a stronger reason to move again. This is not something I would read as a trading signal. It is better viewed as a market that is still looking for direction.
3. The area around USD4,050 to USD4,056 looked like the main holding zone on that chart. On the upper side, the USD4,070 to USD4,075 area looked like the part gold could not hold earlier. For normal readers, the important point is not to memorise those levels. The practical point is that gold had not broken higher with real strength, but it had also not lost the wider support story above USD4,000.
Why Did Gold Move This Way?
 The US dollar is often one of the key factors influencing gold prices. When the dollar is firmer, gold can face more noticeable pressure.
1. The move came from a few things happening at the same time. Kitco noted that gold was still holding above the USD4,000 area, but stronger follow-through was being capped by Fed-rate risk, firm US Treasury yields and resilient US economic data. When the US economy still looks fairly solid, the market is usually slower to assume that the Fed will cut interest rates aggressively.
2. That matters because gold does not pay interest or dividends. If US bonds are still offering attractive returns, some large investors may prefer assets that give them a fixed yield. So gold can still hold up, especially when uncertainty is around, but it may struggle to build a cleaner rally if yields and rate expectations stay firm.
3. At the same time, Reuters reported that gold gained as oil pulled back and investors watched developments in the Middle East. That kept some safe-haven interest in the background. In simple terms, one side of the market still had reasons to look at gold, but another side was still watching the Fed and bond yields. That is why the reading was mixed: gold had support, but not enough fresh strength to create a clear new direction.
What Does This Mean For Malaysian Gold Savers?
 For Malaysian gold savers, the key point is not only whether prices rise or fall. What matters more is budget, discipline and a clear purpose.
1. For Malaysian gold savers, it is better not to read gold through the US dollar price alone. Global gold is quoted in USD, but most of us save and buy in Ringgit. When USD/MYR moves, the local feeling of the gold price can look different, even if XAU/USD itself does not move much.
2. In this price reference, global spot gold was around RM533.47 per gram after conversion using USD/MYR at about 4.09098. But again, this is only the global spot conversion. If you check local physical gold prices in Malaysia, the number can be higher because physical gold includes spread, premium, product form and local selling structure.
3. The way I see it at Sifu Gold, the useful question is not only whether gold was “up” or “down”. The better question is whether the gold-saving plan still makes sense based on budget, holding period and discipline. Gold still has a longer-term support story, but short-term movement can still be held back by the Fed, US yields and stronger US data.
What Practical Action Makes More Sense?
 When gold prices move quickly, better decisions usually come from disciplined planning, not panic reactions.
1. If you already have a monthly budget set aside for gold, small staged buying can still make more sense than trying to guess the lowest price. When the market has no clear new direction, splitting the budget can help reduce emotional pressure. Buy according to your plan and affordability, not because you are afraid of missing out.
2. If this month’s budget is tight, it is also reasonable to check your cash flow first. Gold can be useful as a long-term savings asset, but home commitments, family needs, emergency funds and basic expenses still come first. Do not go in heavily all at once just because the price moved a little. Gold should help build savings, not make daily finances feel squeezed.
3. If you are still unsure, watch a few simple things: XAU/USD, USD/MYR, the direction of US Treasury yields and local physical gold prices. You do not need to be a trader to follow the story. The simple version is this: when the US dollar or US yields stay strong, gold may find it harder to rise. If that pressure eases, gold may get more room. From there, build your saving plan around your own budget.
Conclusion
The conclusion for 25 July 2026 is straightforward. Gold was still holding above the wider USD4,000 area, with the price reference around USD4,055.95 per troy ounce, or about RM533.47 per gram after converting global spot gold into Ringgit. But the market still had no clear new direction because the Fed rate story, US Treasury yields and resilient US economic data were still holding back stronger momentum. For me at Sifu Gold, this kind of market is better treated as a time to organise the plan, not chase one or two days of price movement. If the budget is already there, build grams in stages. If the budget is not ready, check first and wait for a setup that fits your own plan better. For those who want to start small, the Gold Accumulation Program by Public Gold allows you to begin saving gold from as low as RM100, based on your own affordability and discipline.

