


What happened to gold on 26 August 2026? Gold looked pressured after US inflation data did not give the market enough reason to expect quick interest-rate cuts from the Federal Reserve. Once that rate story stayed alive, Treasury yields and the US dollar had more room to firm, and gold found it harder to hold above the USD4,600 area. For Malaysian gold savers, the useful part is not just the fall itself. It is understanding why it happened and what that global price means once translated into Ringgit.
- Introduction
- What Happened To Gold On 26 August 2026?
- What Is The Gold Chart Showing?
- Why Did Gold Move This Way?
- What Does This Mean For Gold Savers?
- Conclusion
What Happened To Gold On 26 August 2026?
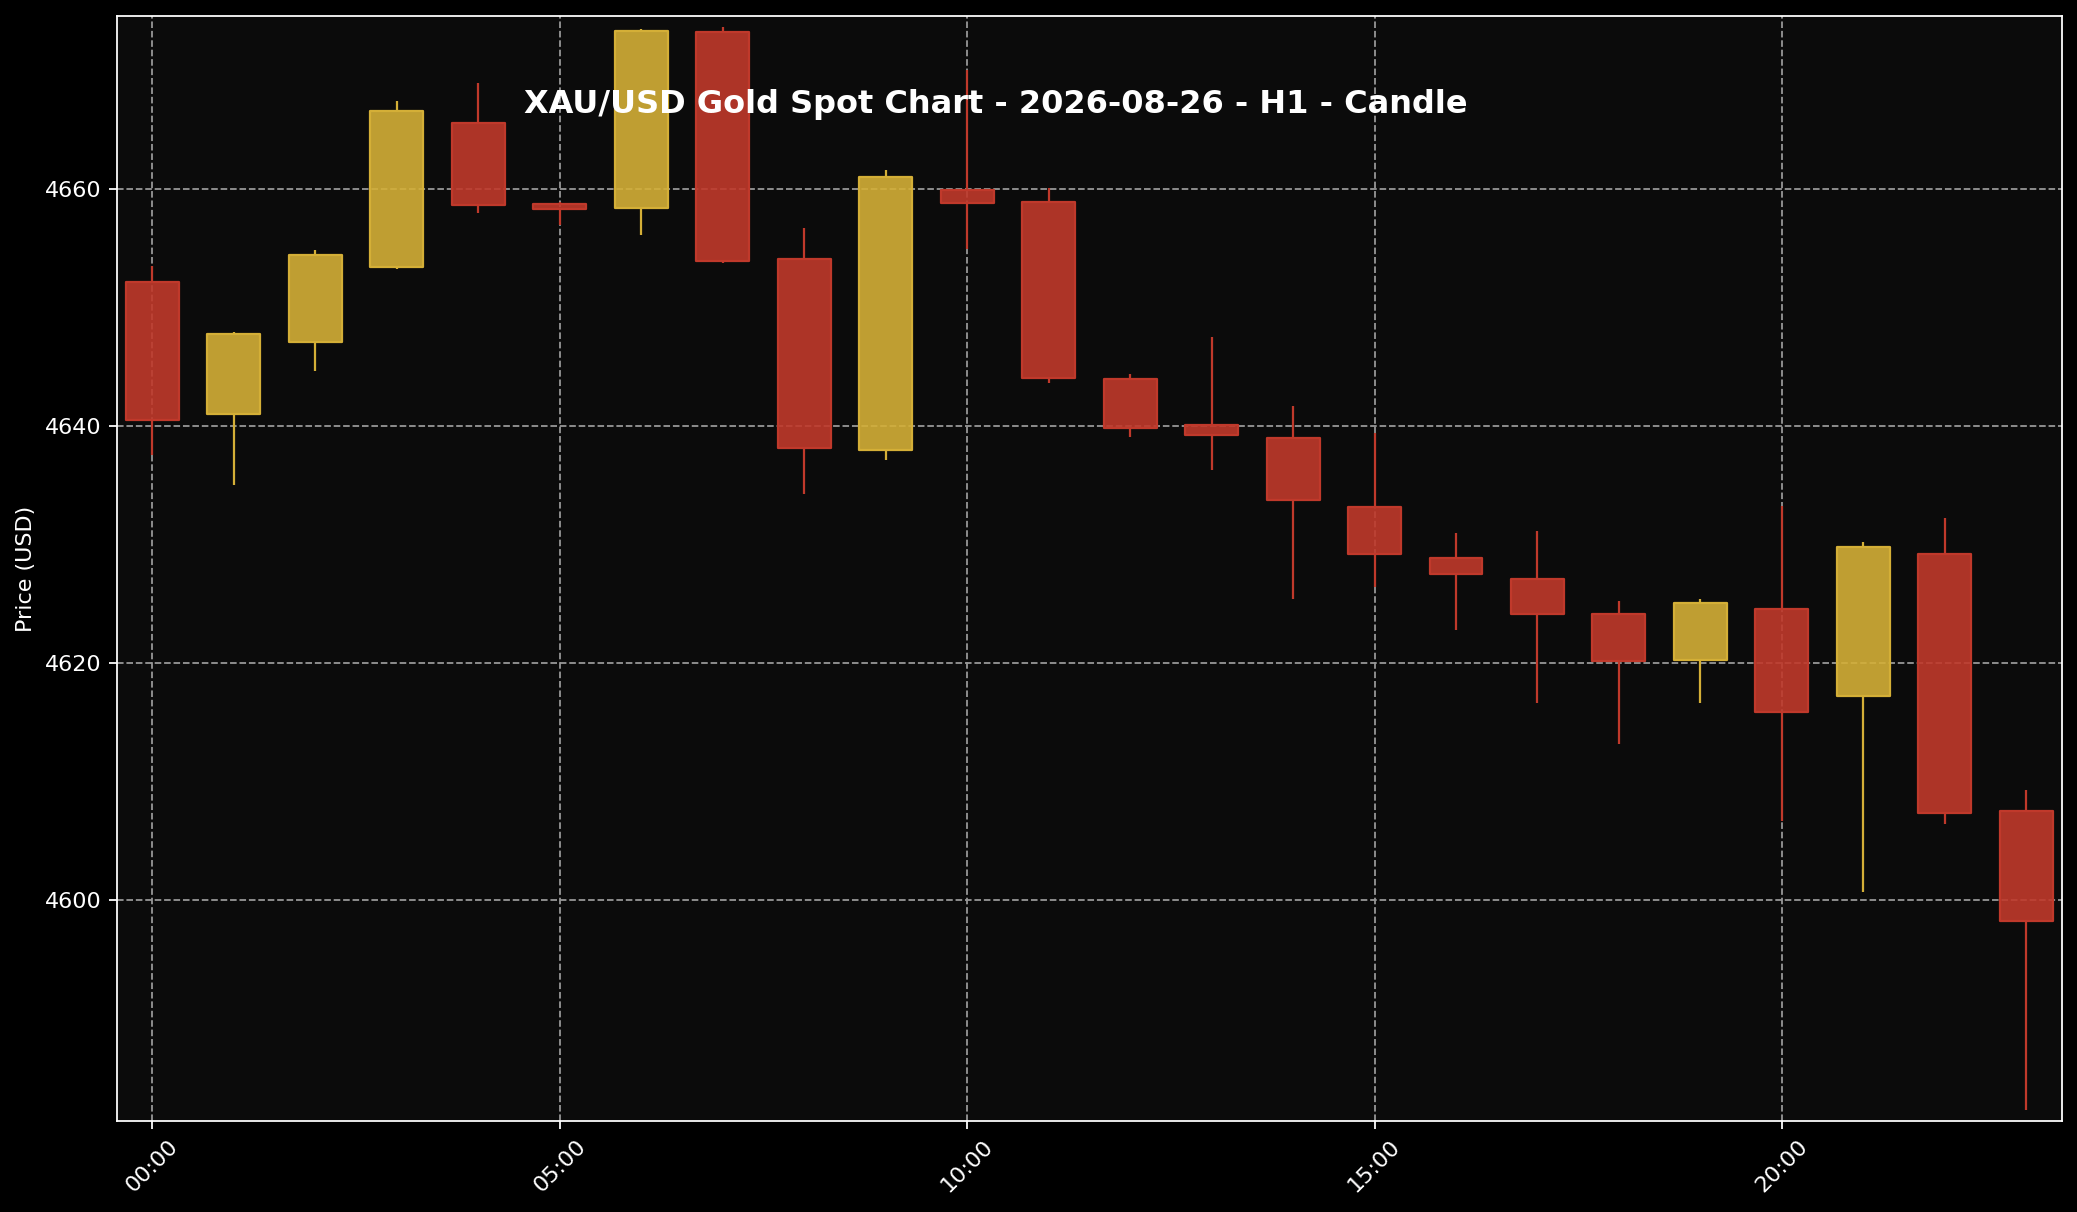 This chart shows the XAU/USD movement for the 26 August 2026 market session. Sifu Gold uses it as a visual reference, not a cue to buy emotionally.
1. On 26 August 2026, global spot gold was around USD4,598.21 per troy ounce at the 11:00 PM Malaysia time reference point. In gram terms, that worked out to about USD147.84 per gram. Using USD/MYR around 4.02633, the same global spot reference translated to roughly RM18,513.89 per troy ounce, or about RM595.24 per gram. These Ringgit figures are global spot conversions, not local physical retail gold prices in Malaysia.
2. The main story came from US inflation data. The numbers were not enough to make the market feel that the Fed could move quickly towards lower rates. When that happens, US Treasury yields can stay attractive and the US dollar can strengthen. Gold usually struggles in that kind of setting because it does not pay interest, while its global price is quoted in US dollars.
3. Kitco described gold as slipping below the USD4,600 area as yields and the US dollar firmed after PCE-related data. Reuters also reported that gold dropped more than 1% after in-line US inflation data. Put simply, the market did not get the kind of surprise that would make gold easier to push higher on that day.
What Is The Gold Chart Showing?
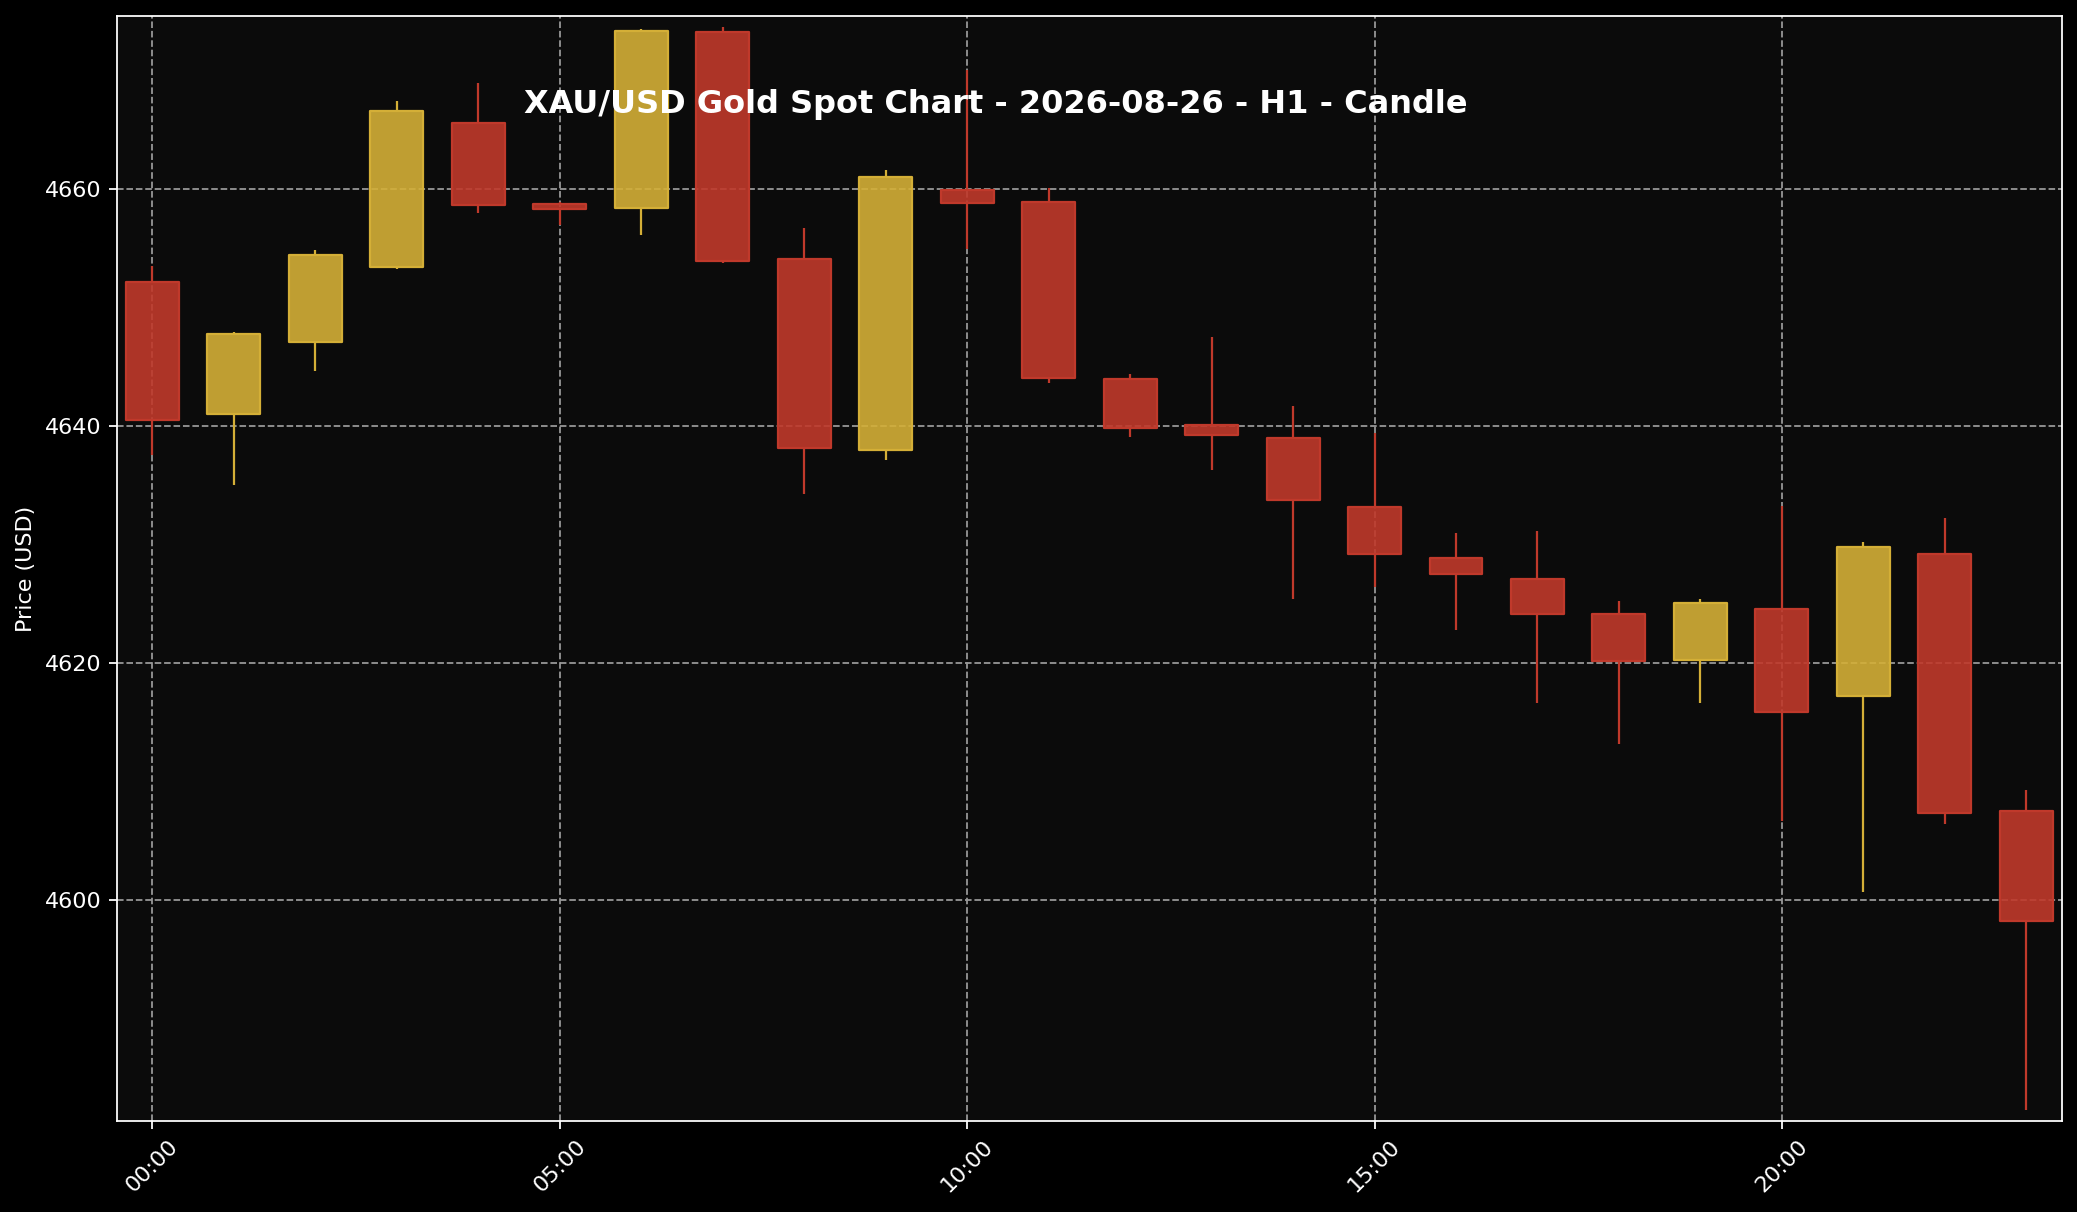 This chart helps readers see the gold price structure for the 26 August 2026 market session. It is used as market context and price-structure reference only.
1. Looking at the XAU/USD H1 chart for 26 August 2026, gold started the session around the higher area, roughly above USD4,640 to USD4,660. After that, the move became weaker step by step. More candles began sitting at lower levels, and by the later part of the session, price was closer to the area below USD4,600.
2. This is not a chart reading for finding a buy or sell point. For Sifu Gold readers, the chart is more useful as a simple picture of daily pressure. Gold did not just dip once and move on. It moved down from a higher area, tried to hold a few times, and then found it harder to stay above the stronger levels as the session went on.
3. Near the end of the chart, gold did try to bounce a little, but selling pressure still came back. That fits the news story quite well. The market still did not have a strong enough reason to bring gold back into a clean recovery. When price sits below USD4,600, the day reads more like a pressured session than a clear rebound.
Why Did Gold Move This Way?
 The US dollar is often one of the key factors influencing gold prices. When the dollar is firmer, gold can face more noticeable pressure.
1. The biggest trigger was US inflation data, especially the PCE-related reading that markets often watch closely because it matters to the Fed. When inflation does not cool enough, the market becomes more careful about expecting lower US interest rates too quickly. In simple terms, traders were not ready to assume that the Fed would change direction fast.
2. When the US rate story stays strong, Treasury yields can rise or remain attractive. Think of it this way: investors can choose between holding gold, which does not pay interest, or holding US bonds, which may offer a more attractive return. When bond returns look better, some investors may prefer bonds for the short term. That can put pressure on gold, even though gold still has a long-term role as a store of value.
3. The US dollar added another layer. Global gold is priced in USD. When the dollar strengthens, buyers using other currencies need to pay more for the same amount of gold. That can slow demand and make it harder for gold to rise. So the chain was quite clear: US inflation data kept the Fed-rate story alive, yields and the dollar firmed, and gold lost momentum.
What Does This Mean For Gold Savers?
 For Malaysian gold savers, the key point is to understand the gap between global spot price and local physical price, then act according to budget and discipline.
1. In my view at Sifu Gold, daily gold moves are better used as a checking point, not as a reason to react emotionally. For Malaysian gold savers, the move below USD4,600 shows that gold was still sensitive to the US rate story. So if gold falls for one day, that alone is not enough to decide the bigger market direction.
2. One point matters here: global spot gold is not the same as local physical gold pricing. The RM595.24 per gram reference above is only the global spot price converted using USD/MYR around 4.02633. Physical gold prices in Malaysia can differ because of product premium, buy-sell spread, operating cost, logistics and local pricing structure. That is why XAU/USD alone does not tell the full story for a physical gold buyer.
3. So what can a saver do? If you already have a monthly gold-saving budget, small staged purchases can still follow the original plan as long as they do not disturb household commitments, family needs or emergency savings. If the budget is tight, or the market still feels unclear, waiting is also a disciplined choice. The key is not to commit the full budget at once just because one day’s price looks lower.
Conclusion
The main takeaway for 26 August 2026 is that gold came under pressure because US inflation data kept the Fed-rate story in focus. When Treasury yields and the US dollar firmed, gold found it harder to keep moving higher. That is why price slipped below the USD4,600 area, with the global spot reference translating to about RM595.24 per gram in Ringgit terms. For gold savers, the better focus is budget, discipline and a complete price picture. Separate global spot conversion from local physical gold prices. If you already have a monthly saving plan, continue according to your own capacity and build gradually. For those who want to start small, the Gold Accumulation Program by Public Gold allows you to begin saving gold from as low as RM100, without needing to use the whole budget at once.

