


What happened to gold on 26 July 2026? Gold was still sitting around USD4,055 per troy ounce. At first glance, that may look like a quiet market. But the story behind it still matters. The market was not giving a clear new direction yet because traders were still weighing the Fed rate story, firm US Treasury yields, resilient US economic data and geopolitical headlines. For Malaysian gold savers, the useful point is not just whether gold moved a little. It is why gold was still holding up, but not pushing strongly higher.
- Introduction
- What Happened To Gold On 26 July 2026?
- What Is The Gold Chart Showing?
- Why Did Gold Move This Way?
- What Does This Mean For Malaysian Gold Savers?
- What Practical Action Makes More Sense?
- Conclusion
What Happened To Gold On 26 July 2026?
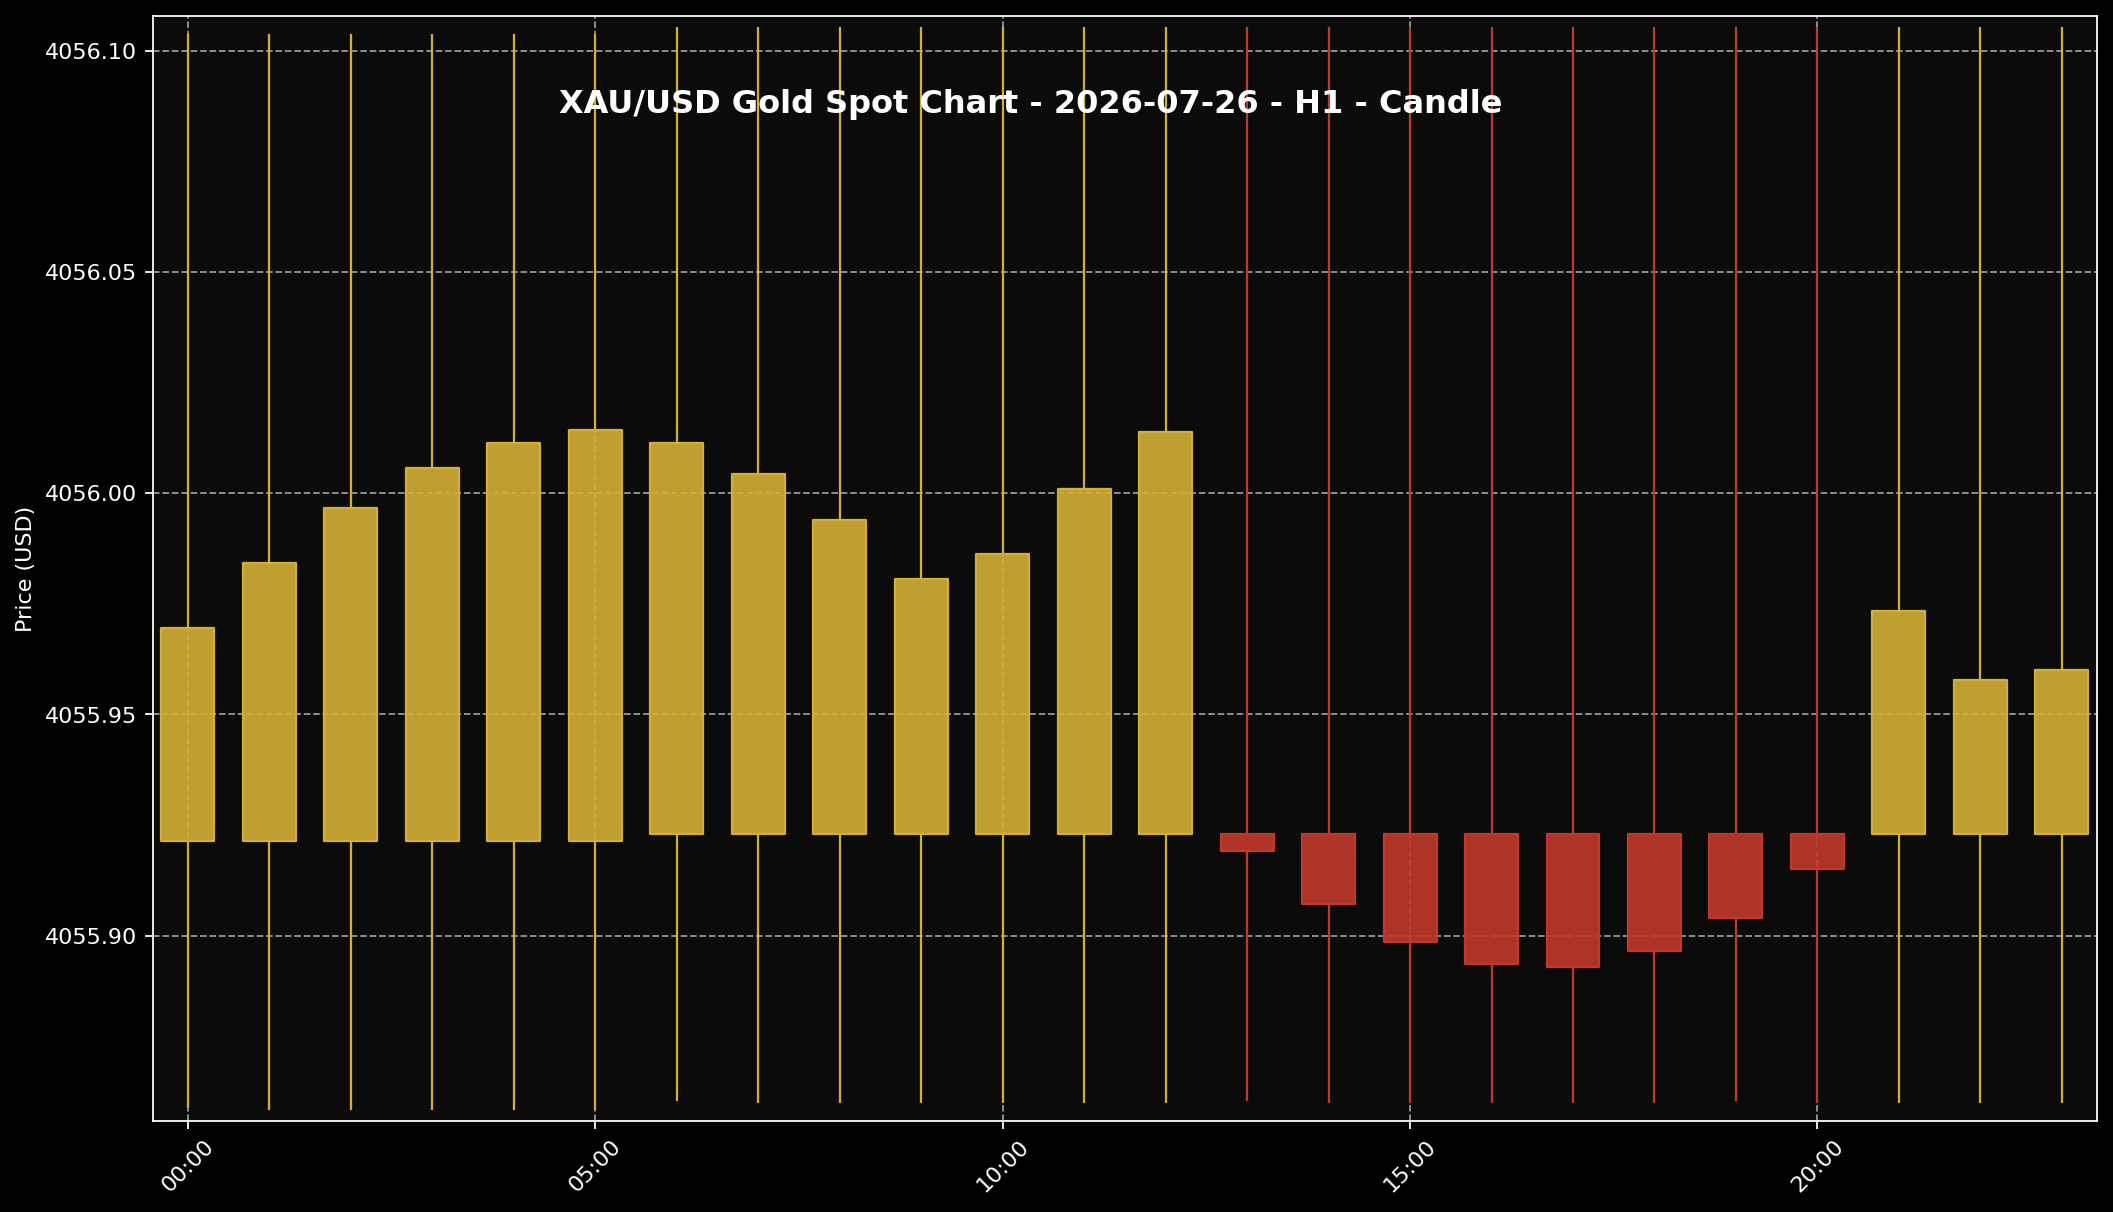 This chart shows the XAU/USD movement for the 26 July 2026 market session. Sifu Gold uses it as a visual reference, not a cue to buy emotionally.
1. On 26 July 2026, global spot gold was around USD4,055.96 per troy ounce at about 11:00 PM Malaysia time. When broken down into grams, that worked out to about USD130.40 per gram. Using USD/MYR at around 4.09075, the same global spot reference translated to roughly RM16,591.92 per troy ounce, or about RM533.44 per gram.
2. That Ringgit conversion matters because Malaysian readers do not experience gold only in US dollar terms. Still, this RM533.44 per gram figure is a global spot conversion. It is not the same as the local physical gold selling price in Malaysia. Physical gold prices can include other layers such as premiums, buy-sell spread, product structure, operating costs and local pricing conditions.
3. The main story that day was simple: gold was still holding above the big USD4,000 area, but it had not found a strong new direction. On one side, safe-haven interest and Middle East developments still gave gold some support. On the other side, the Fed rate story, firm US bond yields and resilient US data made it harder for gold to move much higher.
What Is The Gold Chart Showing?
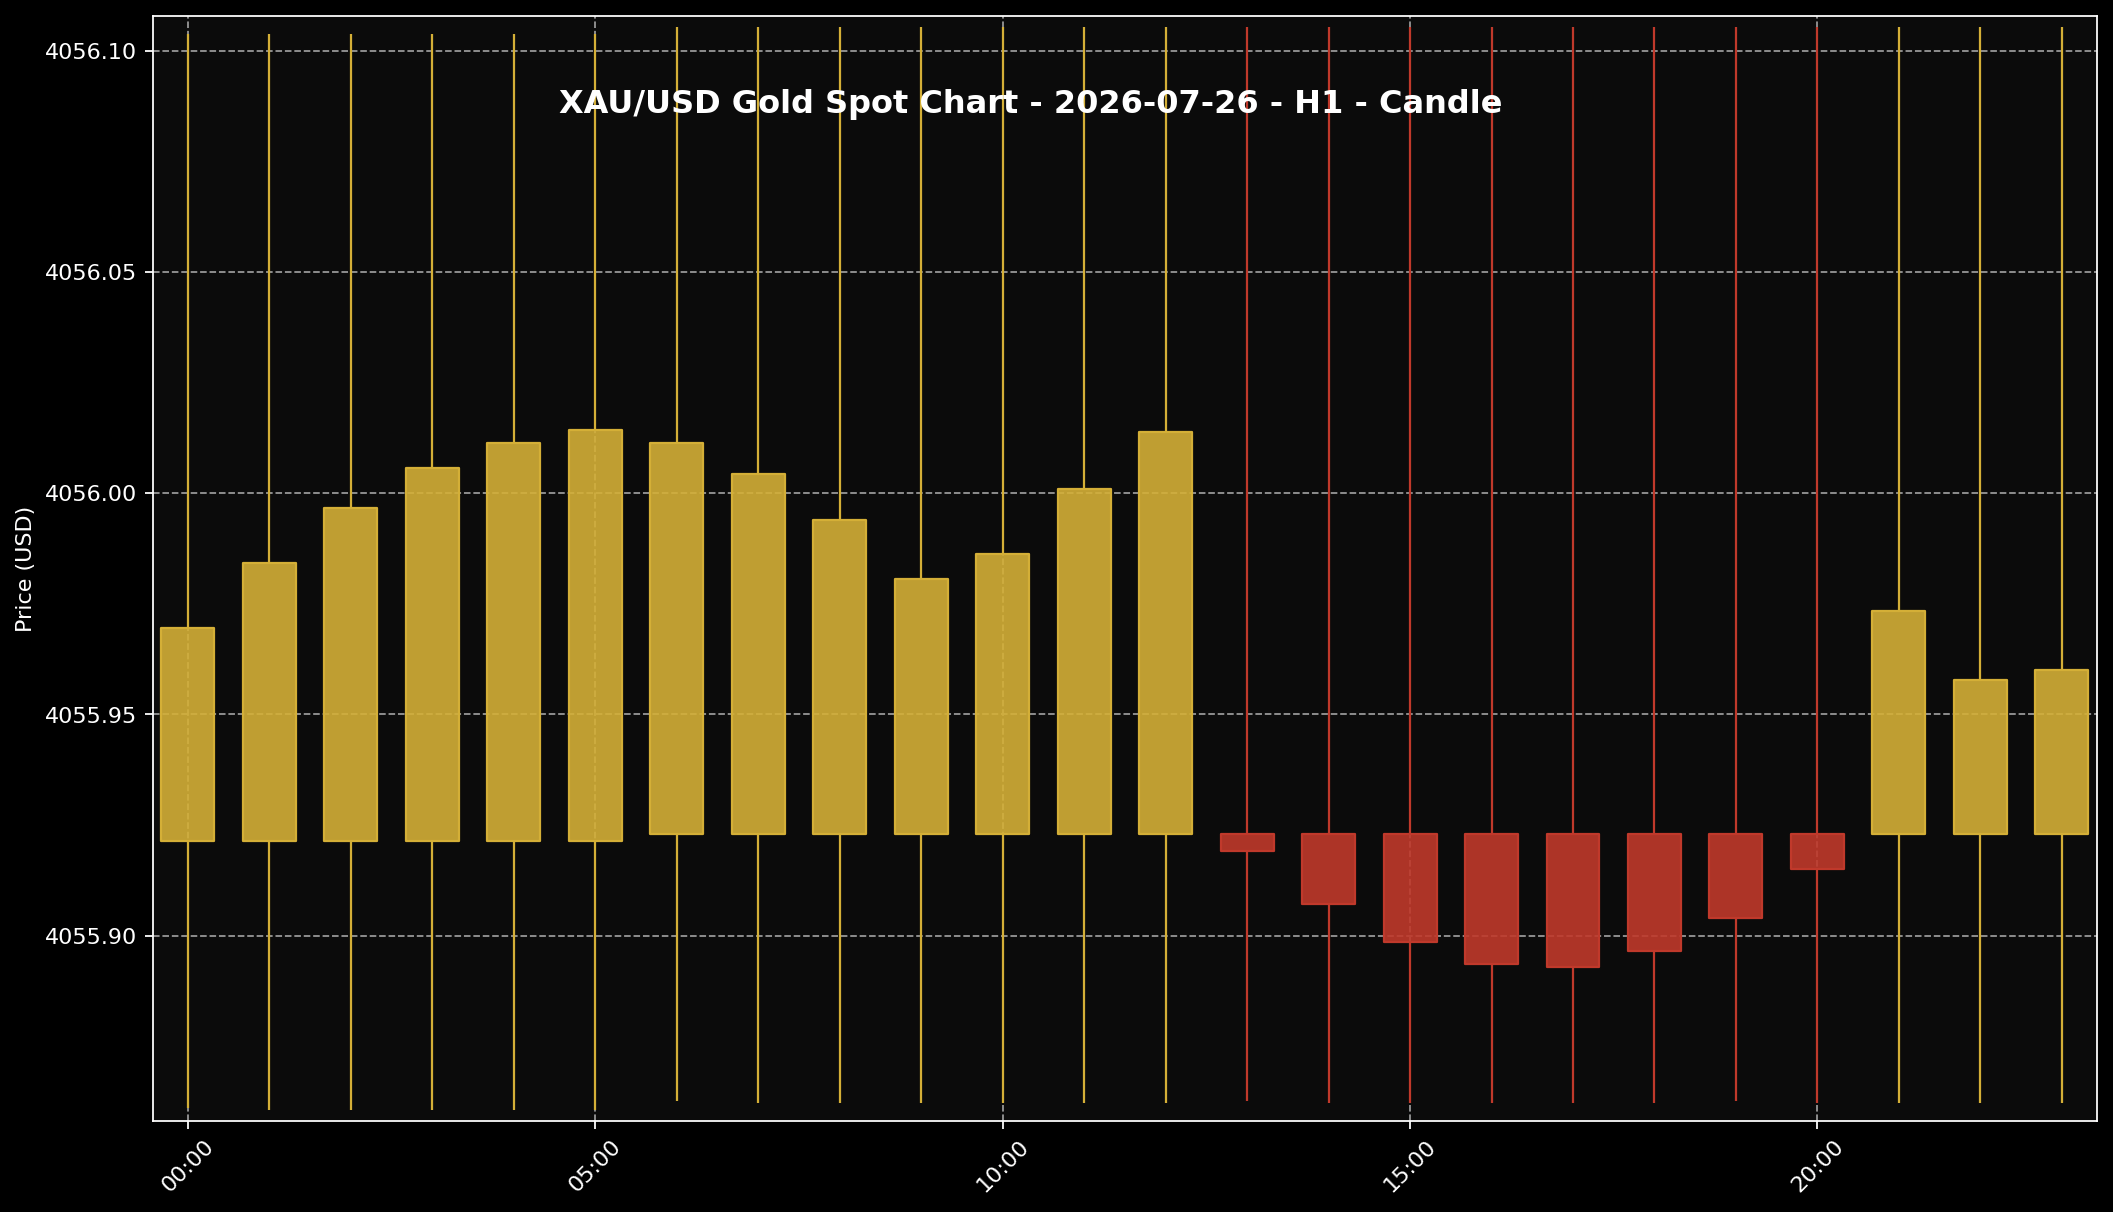 This chart helps readers see the gold price structure for the 26 July 2026 market session. It is used as market context and price-structure reference only.
1. The H1 gold chart for 26 July 2026 showed a very tight movement around the USD4,055.90 to USD4,056.10 area. That is a small range. In plain English, gold was not showing a sharp jump or a sharp fall in that chart reading. It looked more like a market moving slowly while waiting for stronger direction.
2. Early on, the candles were sitting slightly higher. After that, a few red candles showed a small pullback. Towards the end of the chart, gold tried to lift a little again. But this is only a simple reading of market structure. It is not a buying or selling signal, and it should not be treated like a trading setup.
3. The way I see it, the chart matched the wider market story. Gold was not breaking down. But it was also not showing fresh strength yet. The USD4,000 area still mattered as a big psychological reference, while the area above USD4,100 had not been held strongly before this. So for that session, gold looked more like it was holding its ground rather than starting a big new move.
Why Did Gold Move This Way?
 The US dollar is often one of the key factors influencing gold prices. When the dollar is firmer, gold can face more noticeable pressure.
1. The clearest pressure came from the Fed and US Treasury yields. When the market thinks US interest rates may stay higher for longer, gold usually finds it harder to build strong momentum. The reason is quite simple. Gold does not pay interest. So when US bonds still offer attractive yields, some investors may prefer to wait or keep money in assets that give a fixed return.
2. US economic data also played a part. When US business activity still looks fairly resilient, the market has less reason to believe the Fed will rush into cutting rates. That can keep the US dollar and Treasury yields firmer. For gold, that usually becomes a cap on stronger upside because gold is priced in US dollars and competes with interest-bearing assets.
3. At the same time, gold did not fall hard because there were still support factors. Investors were watching Middle East developments, and that kind of uncertainty can keep some interest in gold as a safe-haven asset. So the market was being pulled in two directions. There were reasons for gold to hold up, but also reasons why buyers were not pushing it much higher yet.
What Does This Mean For Malaysian Gold Savers?
 For Malaysian gold savers, the key point is not only whether prices rise or fall. What matters more is budget, discipline and a clear purpose.
1. For Malaysian gold savers, the 26 July 2026 reading gives one clear message. Gold still looked high in Ringgit terms, but the daily move was not strong enough to call it a fresh new trend. So if you save physical gold, it is not enough to look at XAU/USD alone. You also have to look at USD/MYR and the difference between global spot gold and local physical gold pricing.
2. When global spot gold translates to around RM533.44 per gram, that gives a useful base reference for the value of gold in Ringgit. But the gold price you see locally can be different. Physical gold in Malaysia may include premiums, spread, product type, logistics, operating costs and local pricing structure. That is why local physical prices do not always match the global spot conversion one-to-one.
3. The more useful question for savers is not whether gold moved slightly in one session. It is whether your gold-saving plan still makes sense. Are you saving for the long term? Are you using a monthly budget that does not disturb your commitments? Do you understand the spread before buying physical gold? These questions are more helpful than trying to guess the lowest possible price.
What Practical Action Makes More Sense?
 When gold prices move quickly, better decisions usually come from disciplined planning, not panic reactions.
1. In my view at Sifu Gold, if you already have a monthly budget set aside for gold, small staged buying still makes more sense than chasing one perfect price. You do not need to commit the full budget at once. Split the amount, follow your ability, and build grams gradually. That approach is easier to manage than reacting too strongly to one slow market session.
2. If your budget is tight this month, there is no need to force it. Gold can be a useful long-term savings asset for many people, but household commitments, family needs, emergency funds and cash flow still come first. Gold saving should support better financial discipline. It should not create extra pressure.
3. If the market still feels unclear, watch a few key things: the US dollar, US Treasury yields, Fed statements or decisions, USD/MYR and current local physical gold prices. Once these factors give a clearer picture, it becomes easier to plan your next purchase. The aim is not to be perfect every time. The aim is to have a plan, follow your budget and avoid decisions driven by emotion.
Conclusion
Gold on 26 July 2026 was still around USD4,055.96 per troy ounce, or about RM533.44 per gram when converted into Ringgit using USD/MYR around 4.09075. Gold was still holding above the USD4,000 area, but the market had not shown enough strength to point to a clearer new direction. For me at Sifu Gold, the story was not that gold had collapsed or surged. The real story was that the market was still waiting for stronger clues. The Fed, US Treasury yields, the US dollar and geopolitical developments were still pulling gold from different sides. For Malaysian gold savers, the better step is to check your budget, understand the difference between global spot gold and local physical gold prices, and keep saving in stages if that is already part of your long-term plan. For those just starting, the Gold Accumulation Program by Public Gold allows you to begin saving gold from as low as RM100, based on your own ability.

