


What happened to gold on 28 September 2026? It fell more than 2%, even while geopolitical tensions were still in the picture. This time, the market focused less on safe-haven demand and more on what rising oil prices could mean for inflation and US interest rates. The US dollar and Treasury yields moved higher, adding more pressure to gold. For Malaysian gold savers, the useful point is not just that the price fell. It is why it fell, what the chart shows, and how the global move looks once translated into Ringgit.
- Introduction
- What Happened To Gold On 28 September 2026?
- What Is The Gold Chart Showing?
- Why Did Gold Move This Way?
- What Does This Mean For Gold Savers?
- Conclusion
What Happened To Gold On 28 September 2026?
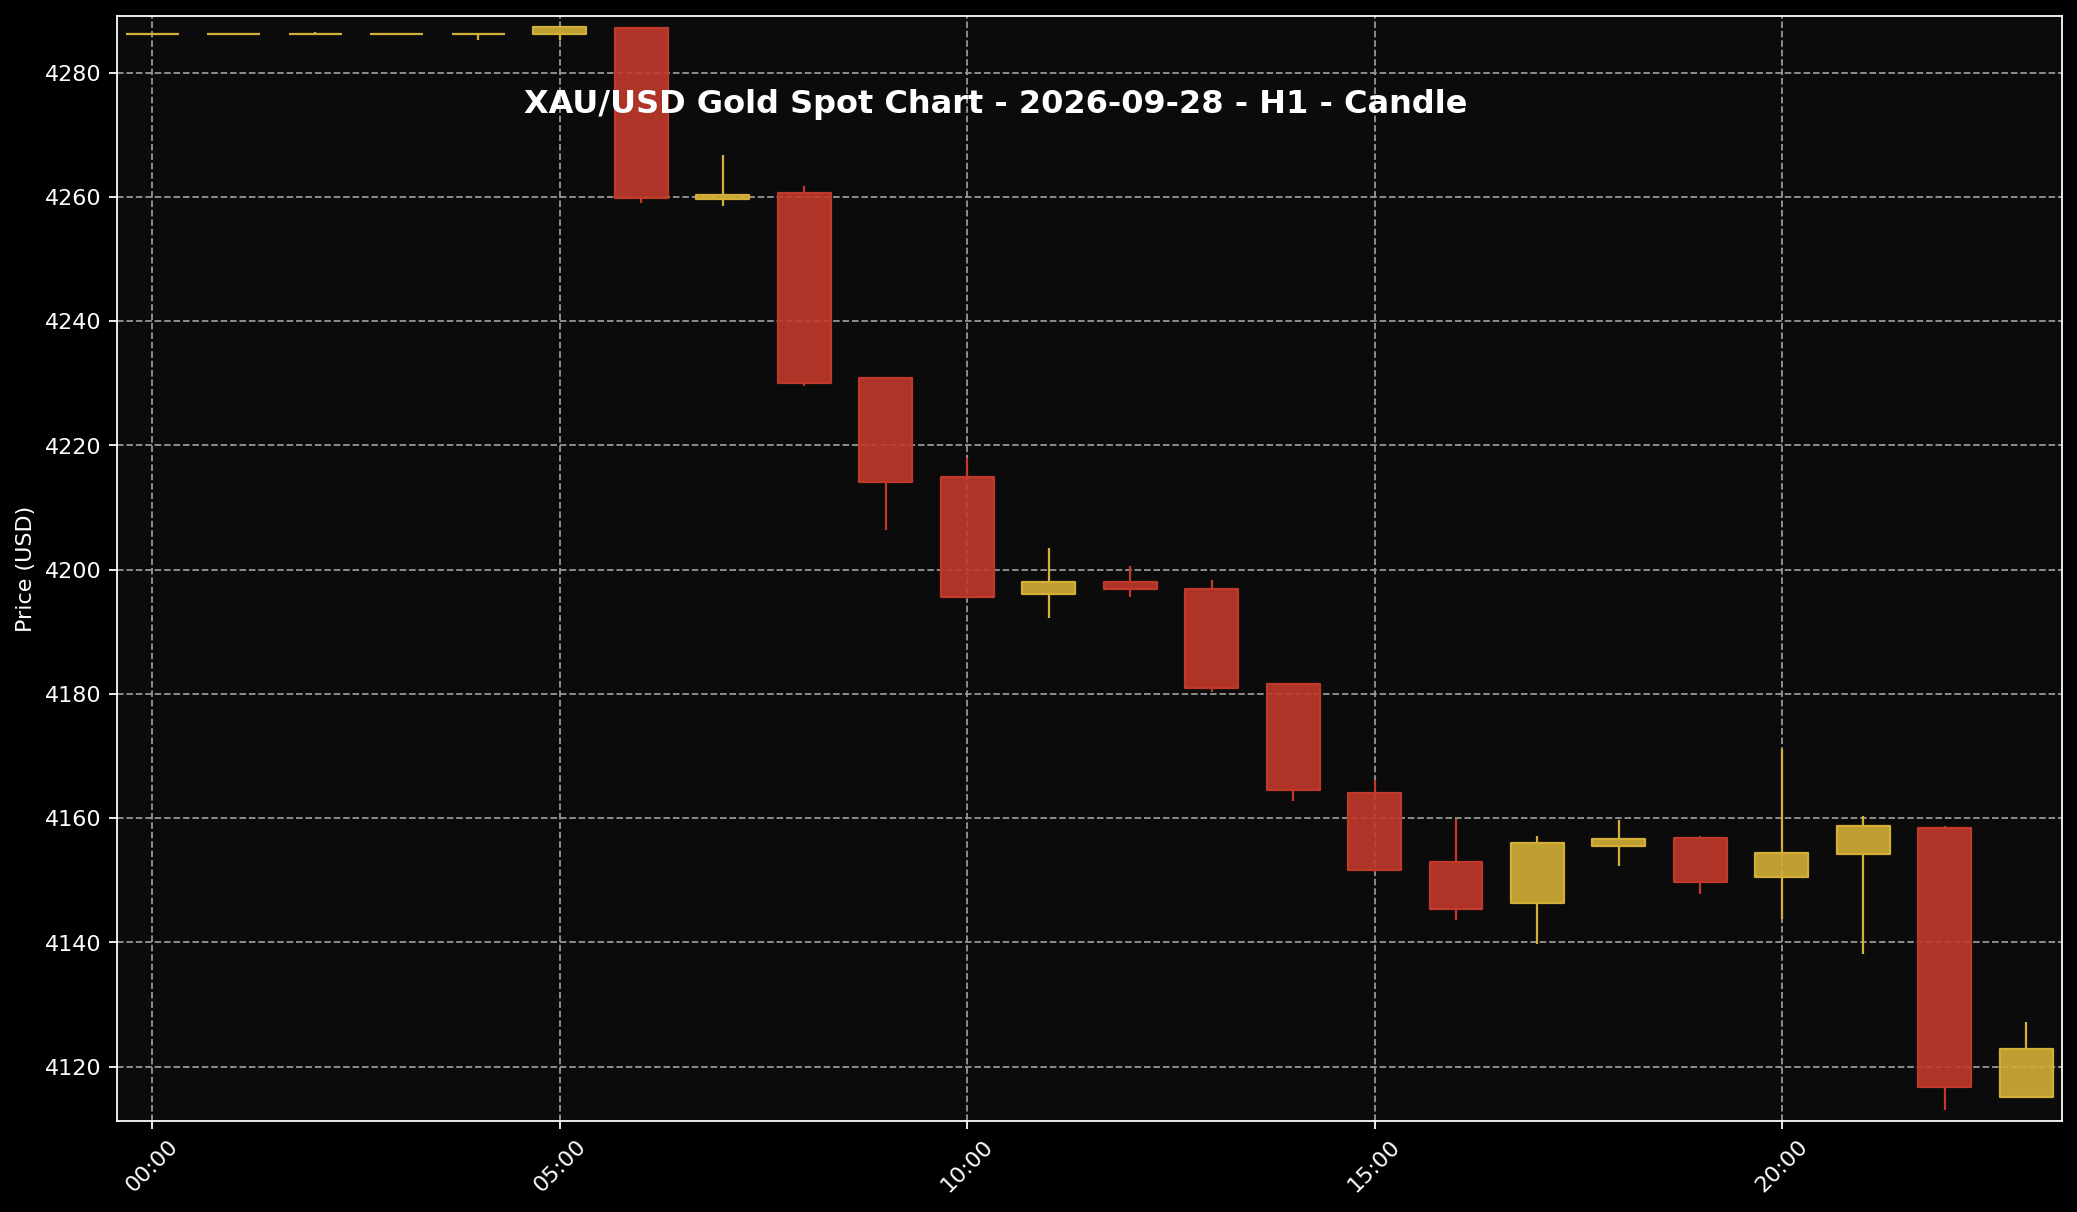 This chart shows the XAU/USD movement for the 28 September 2026 market session. Sifu Gold uses it as a visual reference, not a cue to buy emotionally.
1. Gold fell more than 2% during the session. At the 11.00 pm Malaysia time snapshot, it was around USD4,122.84 per troy ounce, or USD132.55 per gram.
2. Based on USD/MYR at around 4.0823, that worked out to roughly RM16,830.66 per troy ounce or RM541.12 per gram. These Ringgit figures are the global spot price converted into Malaysia’s currency.
3. That does not mean RM541.12 per gram was the price of physical gold in Malaysia. Local physical prices also include premiums, buy-sell spreads and other product costs.
What Is The Gold Chart Showing?
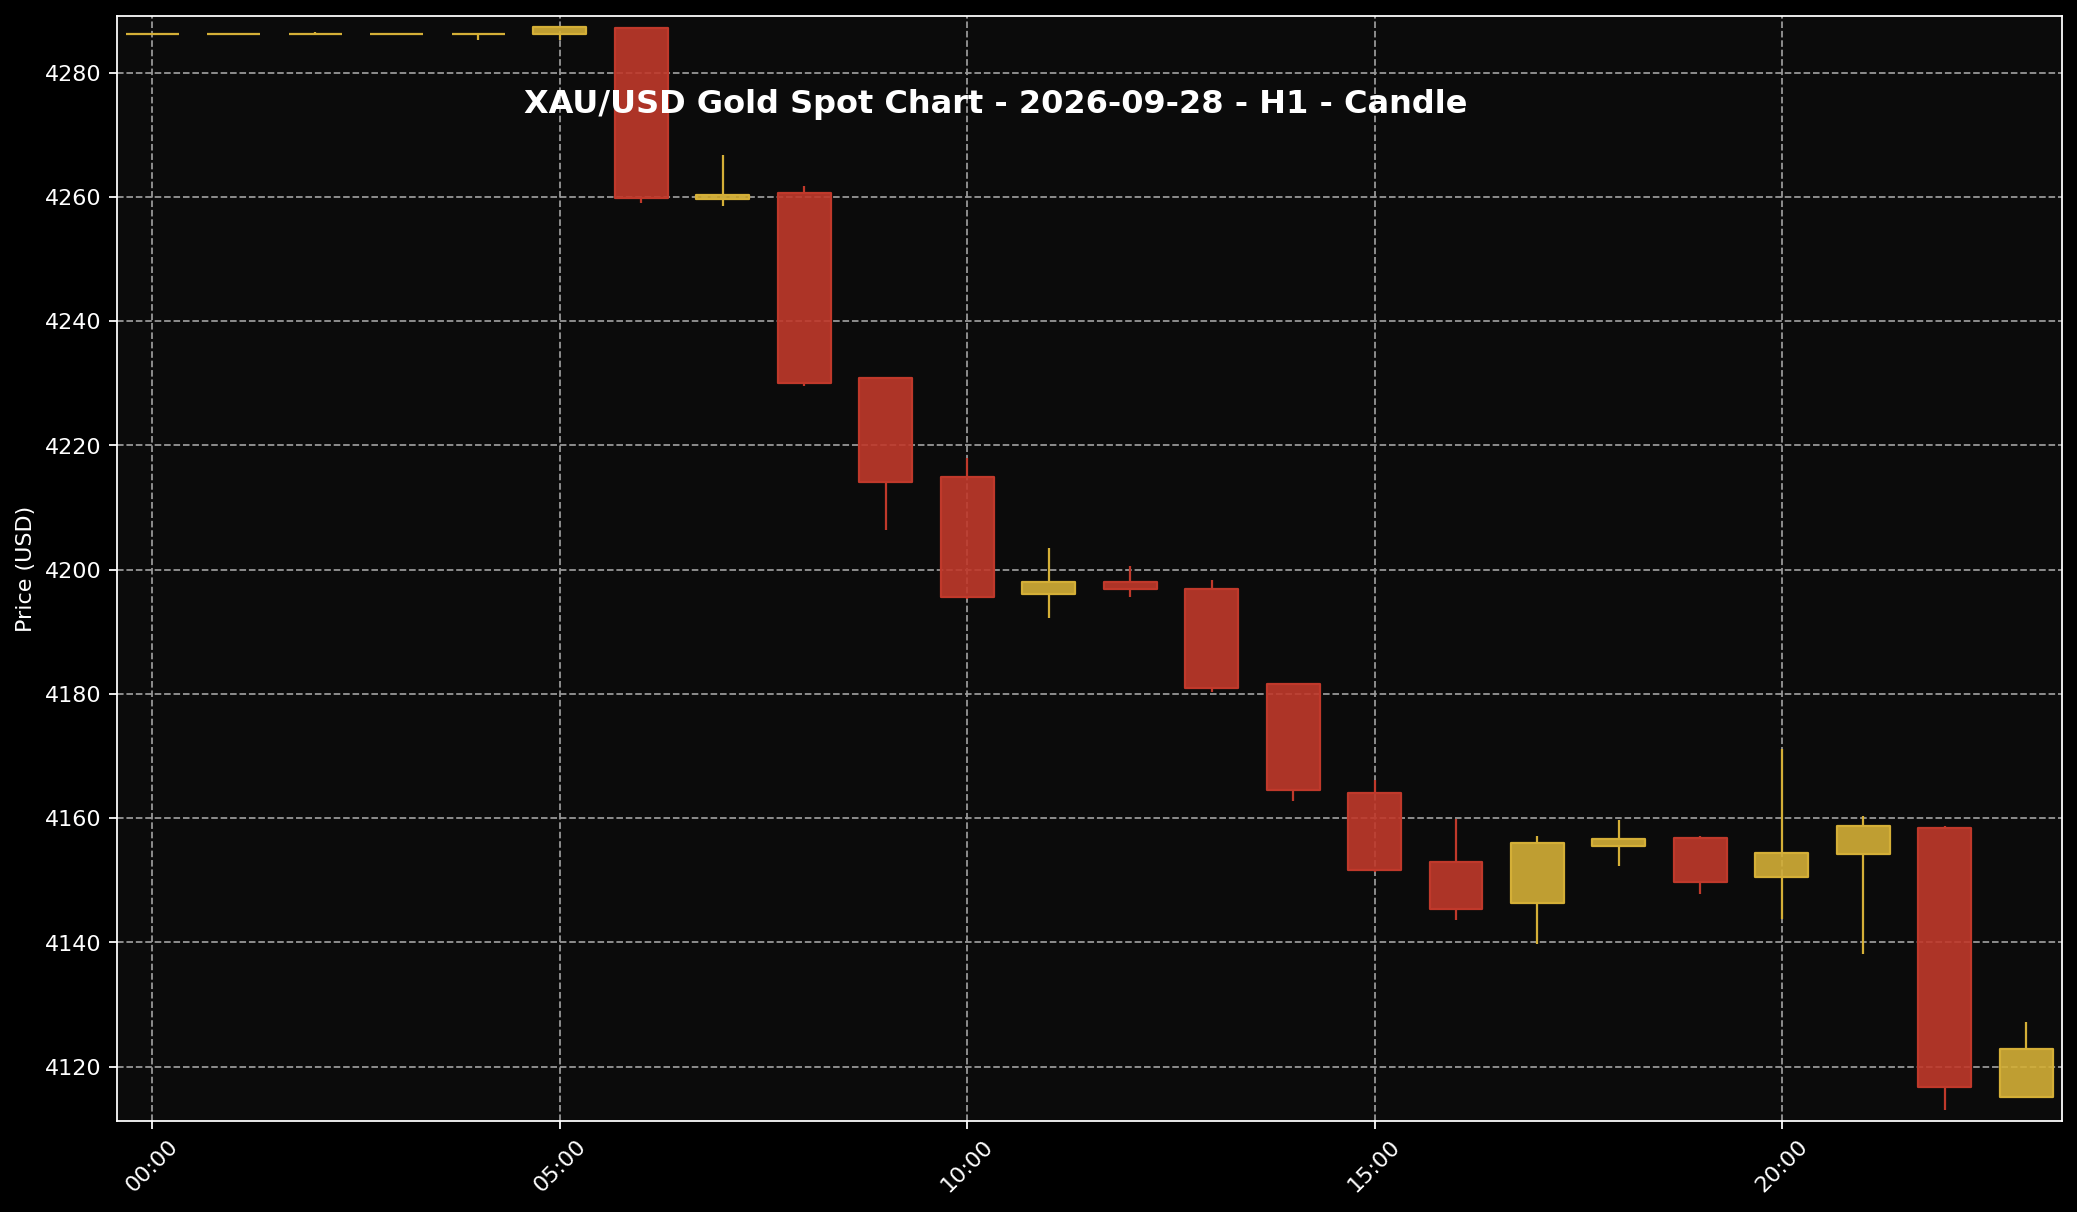 This chart helps readers see the gold price structure for the 28 September 2026 market session. It is used as market context and price-structure reference only.
1. If we look at the H1 chart, the selling pressure is clear. Gold began near USD4,286 and briefly traded around USD4,287.41 before moving lower through the session.
2. The price later fell towards USD4,113.03. There were several attempts to climb back, but each bounce remained short. Gold was around USD4,122.84 at the evening snapshot.
3. Put simply, the small bounce from the day’s low was not enough to show that gold had recovered. Buyers did appear near the lower area, but the main direction that day was still down.
Why Did Gold Move This Way?
 The US dollar is often one of the key factors influencing gold prices. When the dollar is firmer, gold can face more noticeable pressure.
1. The story starts with the tensions and stalemate around Hormuz. That helped oil prices rise again. When oil becomes more expensive, the market starts to worry that higher energy costs could make inflation harder to bring down.
2. From there, traders increased their bets that the Federal Reserve might need to keep interest rates higher or consider another increase. This was still a market expectation, not an official Fed decision.
3. Higher rate expectations gave the US dollar and Treasury yields more support. Treasury yields are simply the returns offered by US government bonds. Those returns can look more attractive when rates rise, while gold pays no interest. A stronger dollar can also make gold more expensive for buyers using other currencies. That is why the oil, inflation and rate story mattered more than gold’s usual safe-haven appeal during this session.
What Does This Mean For Gold Savers?
 For Malaysian gold savers, the key point is to understand the gap between global spot price and local physical price, then act according to budget and discipline.
1. For Malaysian gold savers, a daily fall like this is better treated as something to review, not a reason to react emotionally. A drop of more than 2% is sizeable for one session, but your saving goal, holding period and affordability still matter more.
2. The global spot price is also not the same as the local physical price. USD/MYR plays a part, and the price people see in Malaysia also reflects premiums, buy-sell spreads, operating costs and the type of gold product.
3. If gold is already part of your monthly budget, small purchases made in stages may be considered according to what you can afford. Do not commit the full budget at once just because the price has fallen. If cash flow is tight or your emergency fund is not ready, check those commitments first.
Conclusion
Gold fell more than 2% on 28 September 2026 as rising oil prices brought inflation and US rate concerns back into focus. The US dollar and Treasury yields moved higher, while the chart showed steady selling pressure despite a small bounce near the day’s low. For Malaysian gold savers, the better approach is to understand the difference between global spot and local physical prices, check the budget, and stick with a gradual saving plan rather than reacting to one sharp move.

