


What happened to gold on 29 August 2026? This was not a normal fresh trading day. The global gold market was already in weekend mode, so the better way to read the price is to use the latest available reference and compare it with the last completed session on 28 August 2026. From that angle, gold entered the weekend still under pressure after the US rate story became less friendly for gold.
- Introduction
- What Happened To Gold On 29 August 2026?
- What Is The Gold Chart Showing?
- Why Did Gold Move This Way?
- What Does This Mean For Gold Savers?
- Conclusion
What Happened To Gold On 29 August 2026?
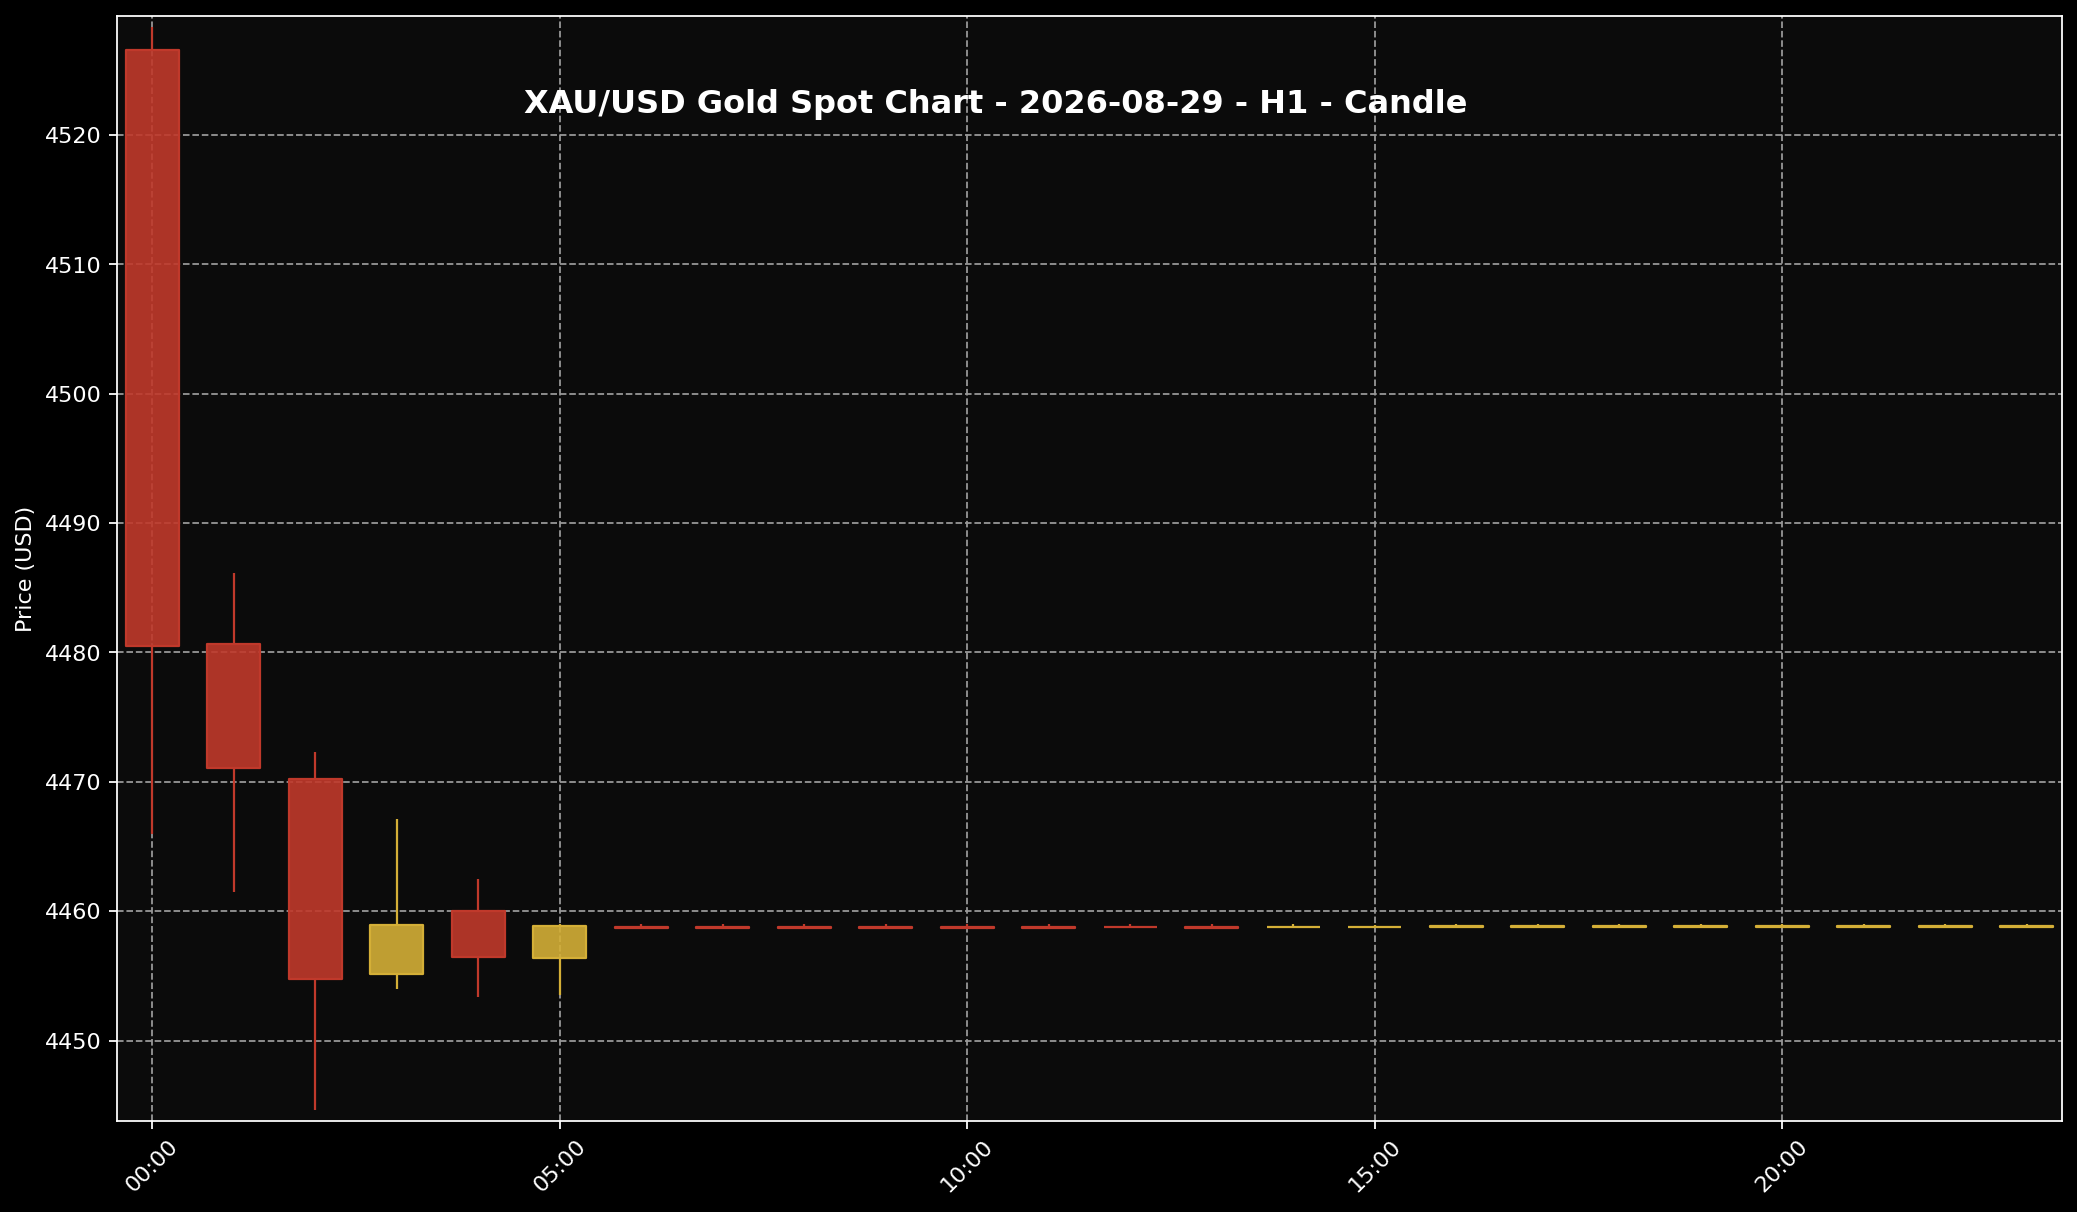 This chart shows the XAU/USD movement for the 29 August 2026 market session. Sifu Gold uses it as a visual reference, not a cue to buy emotionally.
1. On 29 August 2026, gold should be read as a weekend reference, not as a new full active session. Around 11:00 PM Malaysia time, the latest available XAU/USD reference stood near USD4,458.87 per troy ounce. Converted into grams, that is roughly USD143.36 per gram.
2. Using the USD/MYR rate of about 4.02345 from the same reference point, that works out to around RM17,940.05 per troy ounce, or roughly RM576.79 per gram. This is the global spot gold price converted into Ringgit. It is not the same as local physical retail gold pricing in Malaysia.
3. If we look back to the last completed session on 28 August 2026, gold entered the weekend after coming under pressure. Kitco’s market coverage showed gold earlier holding near the USD4,600 area before selling pressure became more visible. So the key point for 29 August is simple: gold was not making a new Saturday move. It was being read from the latest available weekend reference after Friday’s Fed-driven pullback.
What Is The Gold Chart Showing?
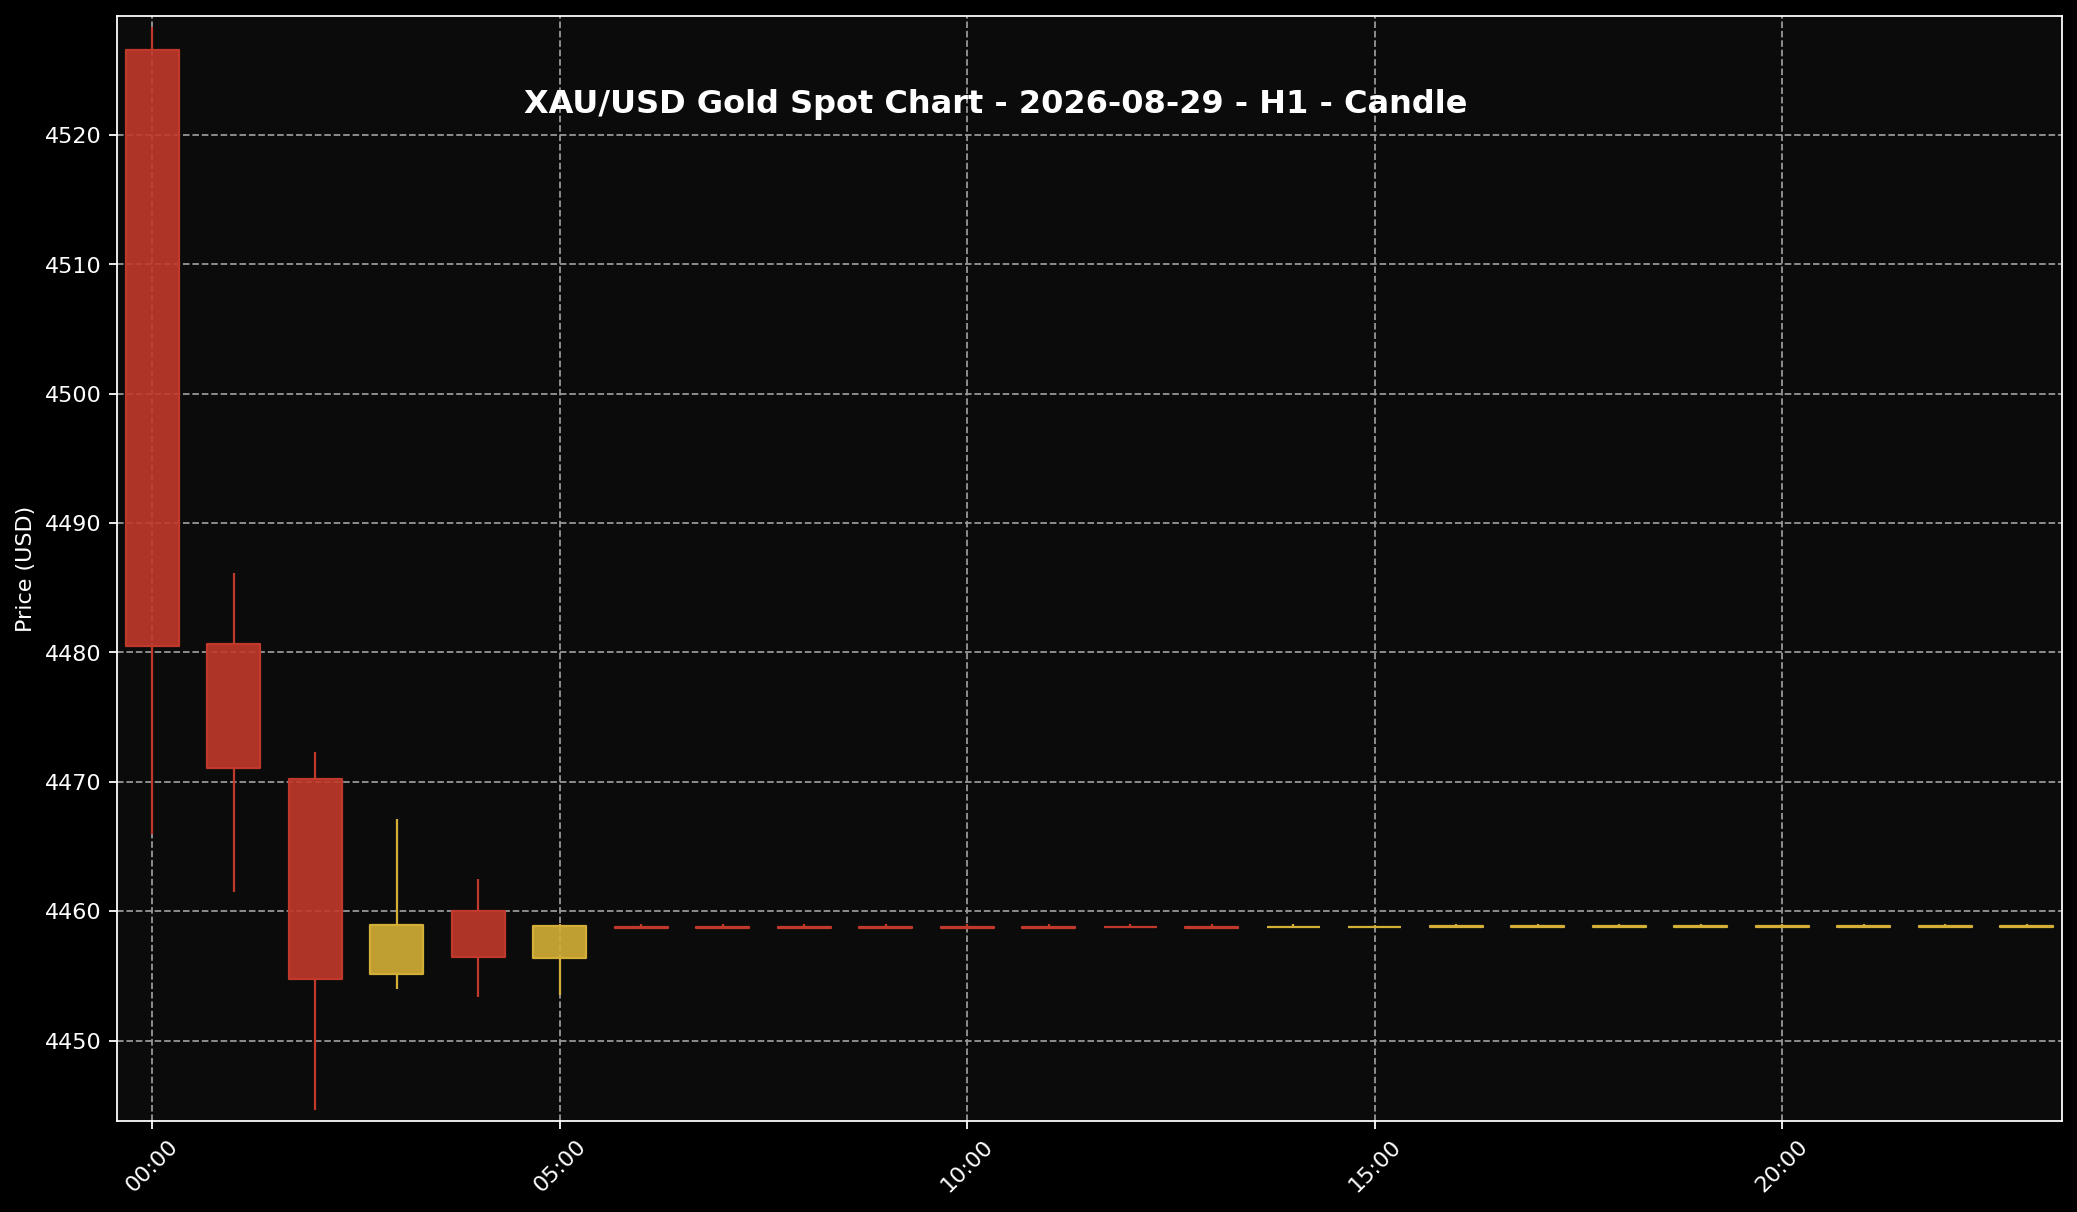 This chart helps readers see the gold price structure for the 29 August 2026 market session. It is used as market context and price-structure reference only.
1. The H1 gold chart showed a clear change in tone. Gold had already dropped sharply earlier, then moved in a smaller range around the USD4,456 to USD4,459 area. That does not look like a market confidently building a new upward push. It looks more like gold had fallen first, then paused near the lower area.
2. The area above, roughly around USD4,480 to USD4,520, looked like a zone gold had left behind after the earlier pressure. When price is sitting well below that kind of area, it tells us that the previous momentum has changed. This is only a chart-reading point, not a trading instruction.
3. Near the lower side, the USD4,450 area looked like a place where gold was trying to hold for the time being. But because the market was already closed for the weekend, small movements around that area should not be treated like a normal live session. The fairer reading is that gold was resting near the lower zone after Friday’s pressure, while the market waited for the next proper session.
Why Did Gold Move This Way?
 The US dollar is often one of the key factors influencing gold prices. When the dollar is firmer, gold can face more noticeable pressure.
1. The main story came from the US interest-rate outlook. In the last completed session, the market was watching comments from Federal Reserve Chair Kevin Warsh. Reuters reported that gold fell after his comments lifted rate-hike expectations, which means traders started to think US rates could stay high or even move higher than previously expected.
2. Why does that matter for gold? Put simply, gold does not pay interest. When the market thinks interest rates may stay higher, assets linked to interest returns can look more attractive in the short term. Some investors then reduce their exposure to gold, especially when they are only looking at shorter-term price movement.
3. Kitco pointed to the same pressure. Gold was only modestly lower earlier near the USD4,600 area, but the selling became clearer after the inflation and Fed-rate story came back into focus. So this was not just a random price move. The market was asking whether the Fed still needed to fight inflation with higher rates. When that answer looked less friendly for gold, the price came under pressure.
What Does This Mean For Gold Savers?
 For Malaysian gold savers, the key point is to understand the gap between global spot price and local physical price, then act according to budget and discipline.
1. For Malaysian gold savers, the 29 August 2026 reference is useful as a checkpoint. Global spot gold was around RM576.79 per gram after converting from US dollars into Ringgit. But that number is still a global spot reference. It helps us understand the market, but it is not automatically the price we see when buying physical gold locally.
2. This is why I prefer to separate two things clearly at Sifu Gold: global spot gold and local physical gold pricing. XAU/USD may move one way, but local physical prices can move differently because USD/MYR, product premium, buy-sell spread, operating cost, logistics and local pricing structure all play a role.
3. From a saver’s point of view, do not chase one weekend snapshot by itself. If you already have a monthly gold-saving budget, small gradual purchases can still follow your own plan. If the budget is not comfortable yet, there is no need to force it. Keep household commitments, family needs and emergency savings in place first. The bigger goal is to build grams with discipline, not to guess the lowest possible price.
Conclusion
Gold on 29 August 2026 should be read as a weekend reference, not a new active trading session. The latest available reference placed gold near USD4,458.87 per ounce, or about RM576.79 per gram after conversion into Ringgit. The direction still links back to the last completed session on 28 August, when gold came under pressure after Fed-rate expectations shifted against it. For me at Sifu Gold, this kind of market setup is a good reminder to check the plan, not just the price. Separate global spot gold from local physical gold pricing. Look at your own budget first. If you already have a steady accumulation plan, continue gradually according to what you can afford. If not, waiting is also a disciplined decision. The Gold Accumulation Program by Public Gold can be a practical way to start from as low as RM100, as long as it fits your budget and is done for long-term saving, not because of one short-term price move.

