


What happened to gold on 31 August 2026? The main story was quite clear. Gold came under pressure because the market started looking again at the risk of higher US interest rates. At the same time, oil headlines around the Strait of Hormuz and US-Iran tensions kept some safe-haven interest alive. So this was not just a simple “gold went down” day. It was more about the market trying to balance rate pressure against defensive demand.
- Introduction
- What Happened To Gold On 31 August 2026?
- What Is The Gold Chart Showing?
- Why Did Gold Move This Way?
- What Does This Mean For Gold Savers?
- Conclusion
What Happened To Gold On 31 August 2026?
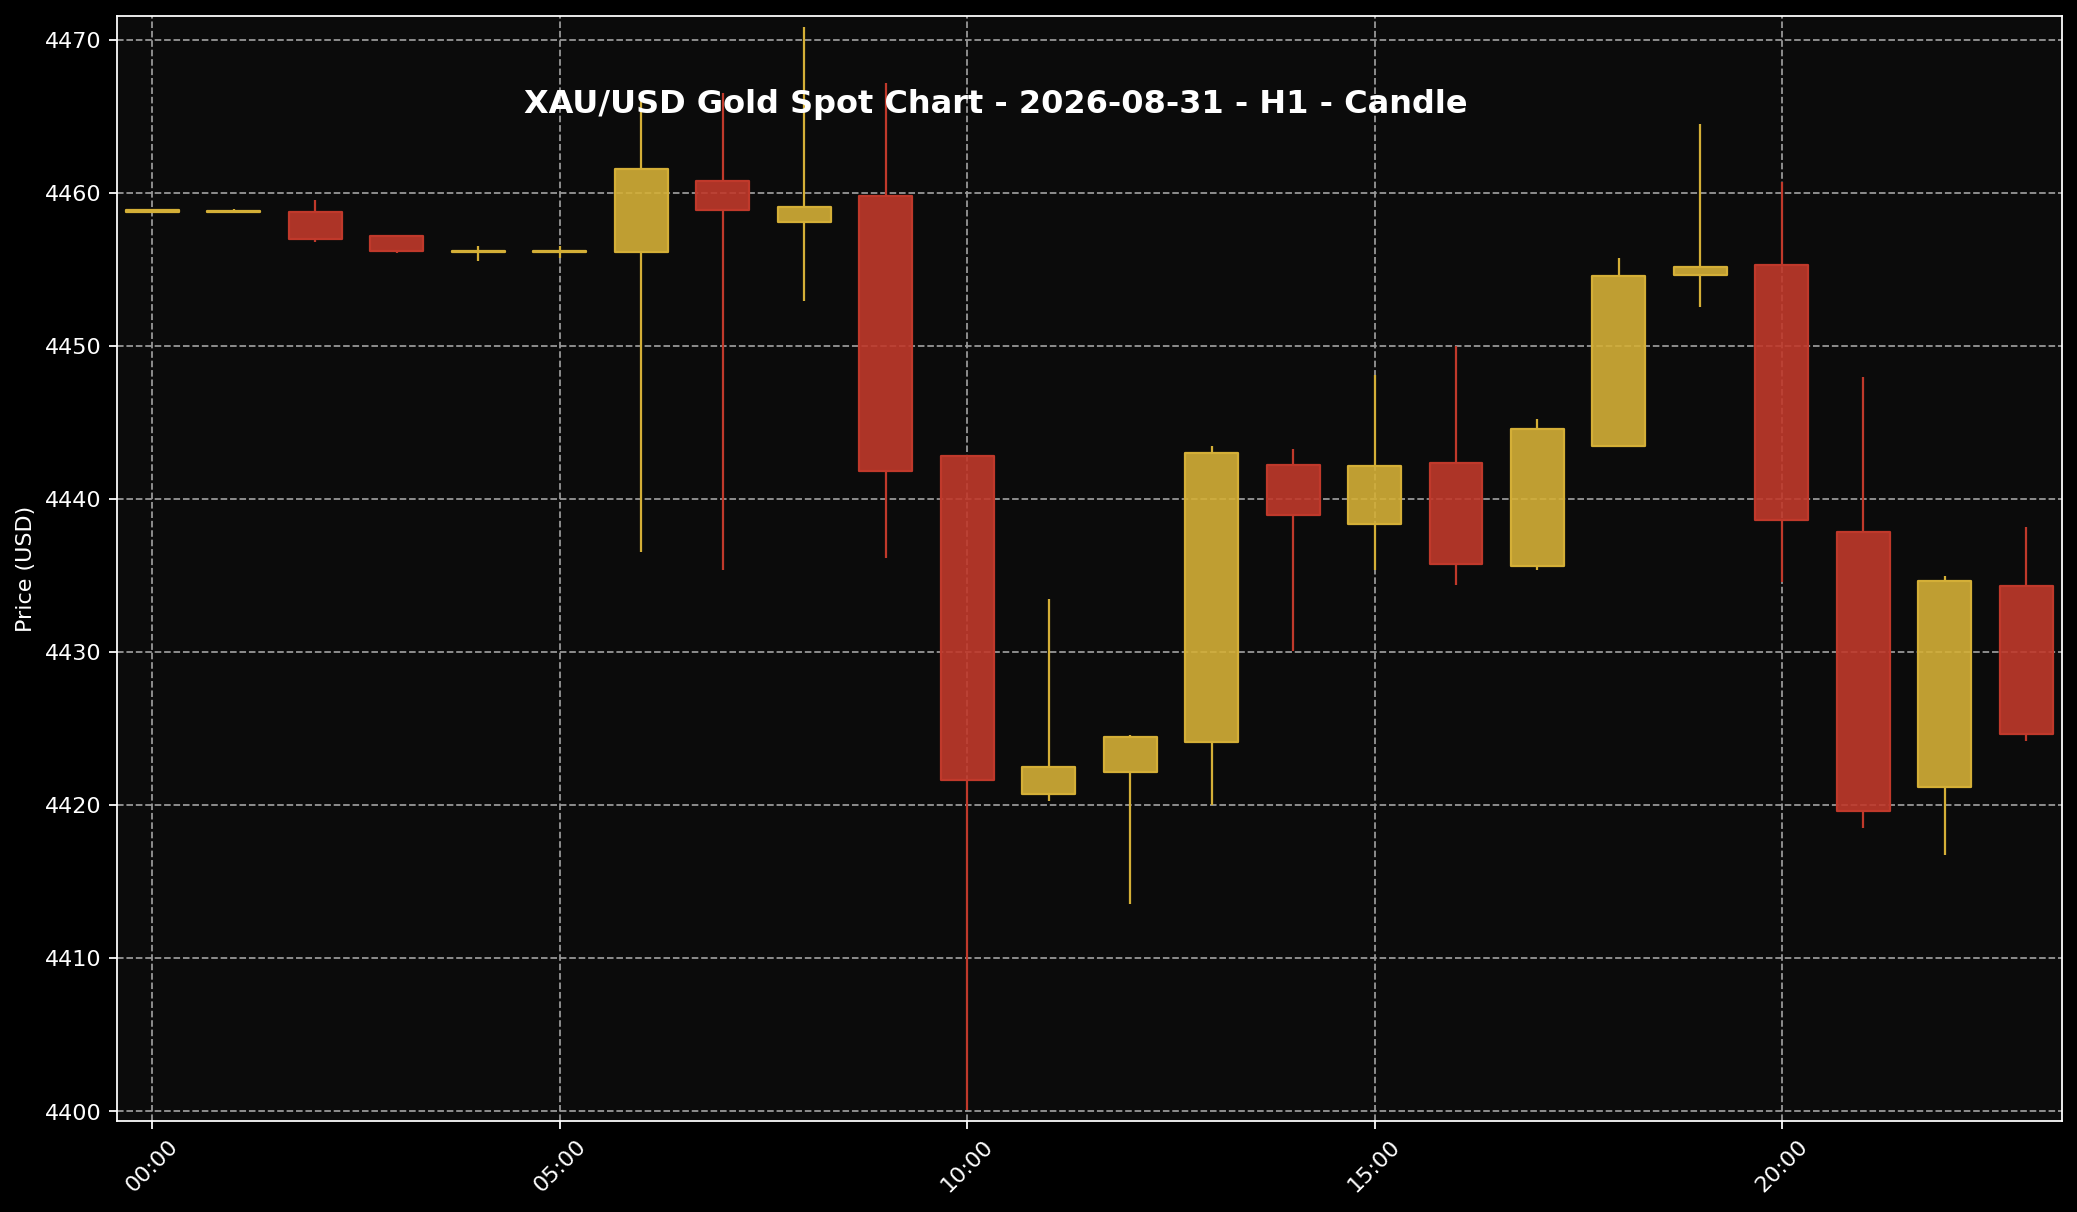 This chart shows the XAU/USD movement for the 31 August 2026 market session. Sifu Gold uses it as a visual reference, not a cue to buy emotionally.
1. At the reference snapshot around 11:00 PM Malaysia time, global spot gold was around USD4,424.66 per troy ounce. Converted into grams, that was about USD142.26 per gram. Based on USD/MYR around 4.02565, the same global spot reference was roughly RM17,812.13 per troy ounce, or about RM572.67 per gram. These Ringgit figures are global spot conversions only. They are not the same as local physical retail gold prices in Malaysia.
2. Gold was under pressure because the market was looking again at US interest-rate risk. Reuters reported that gold slipped near a two-week low as traders priced in Fed rate-hike bets. Put simply, when the market thinks US rates may stay high or move higher, gold can find it harder to rise because gold does not pay interest like bonds do.
3. But the story was not one-sided. Kitco also pointed to the Strait of Hormuz, an oil spike and fresh US-Iran tensions as part of the day’s backdrop. These issues can still support demand for gold as a safe-haven asset. In simple terms, gold was being pulled in two directions: rate pressure on one side, and defensive demand on the other. On that day, the rate pressure looked more dominant.
What Is The Gold Chart Showing?
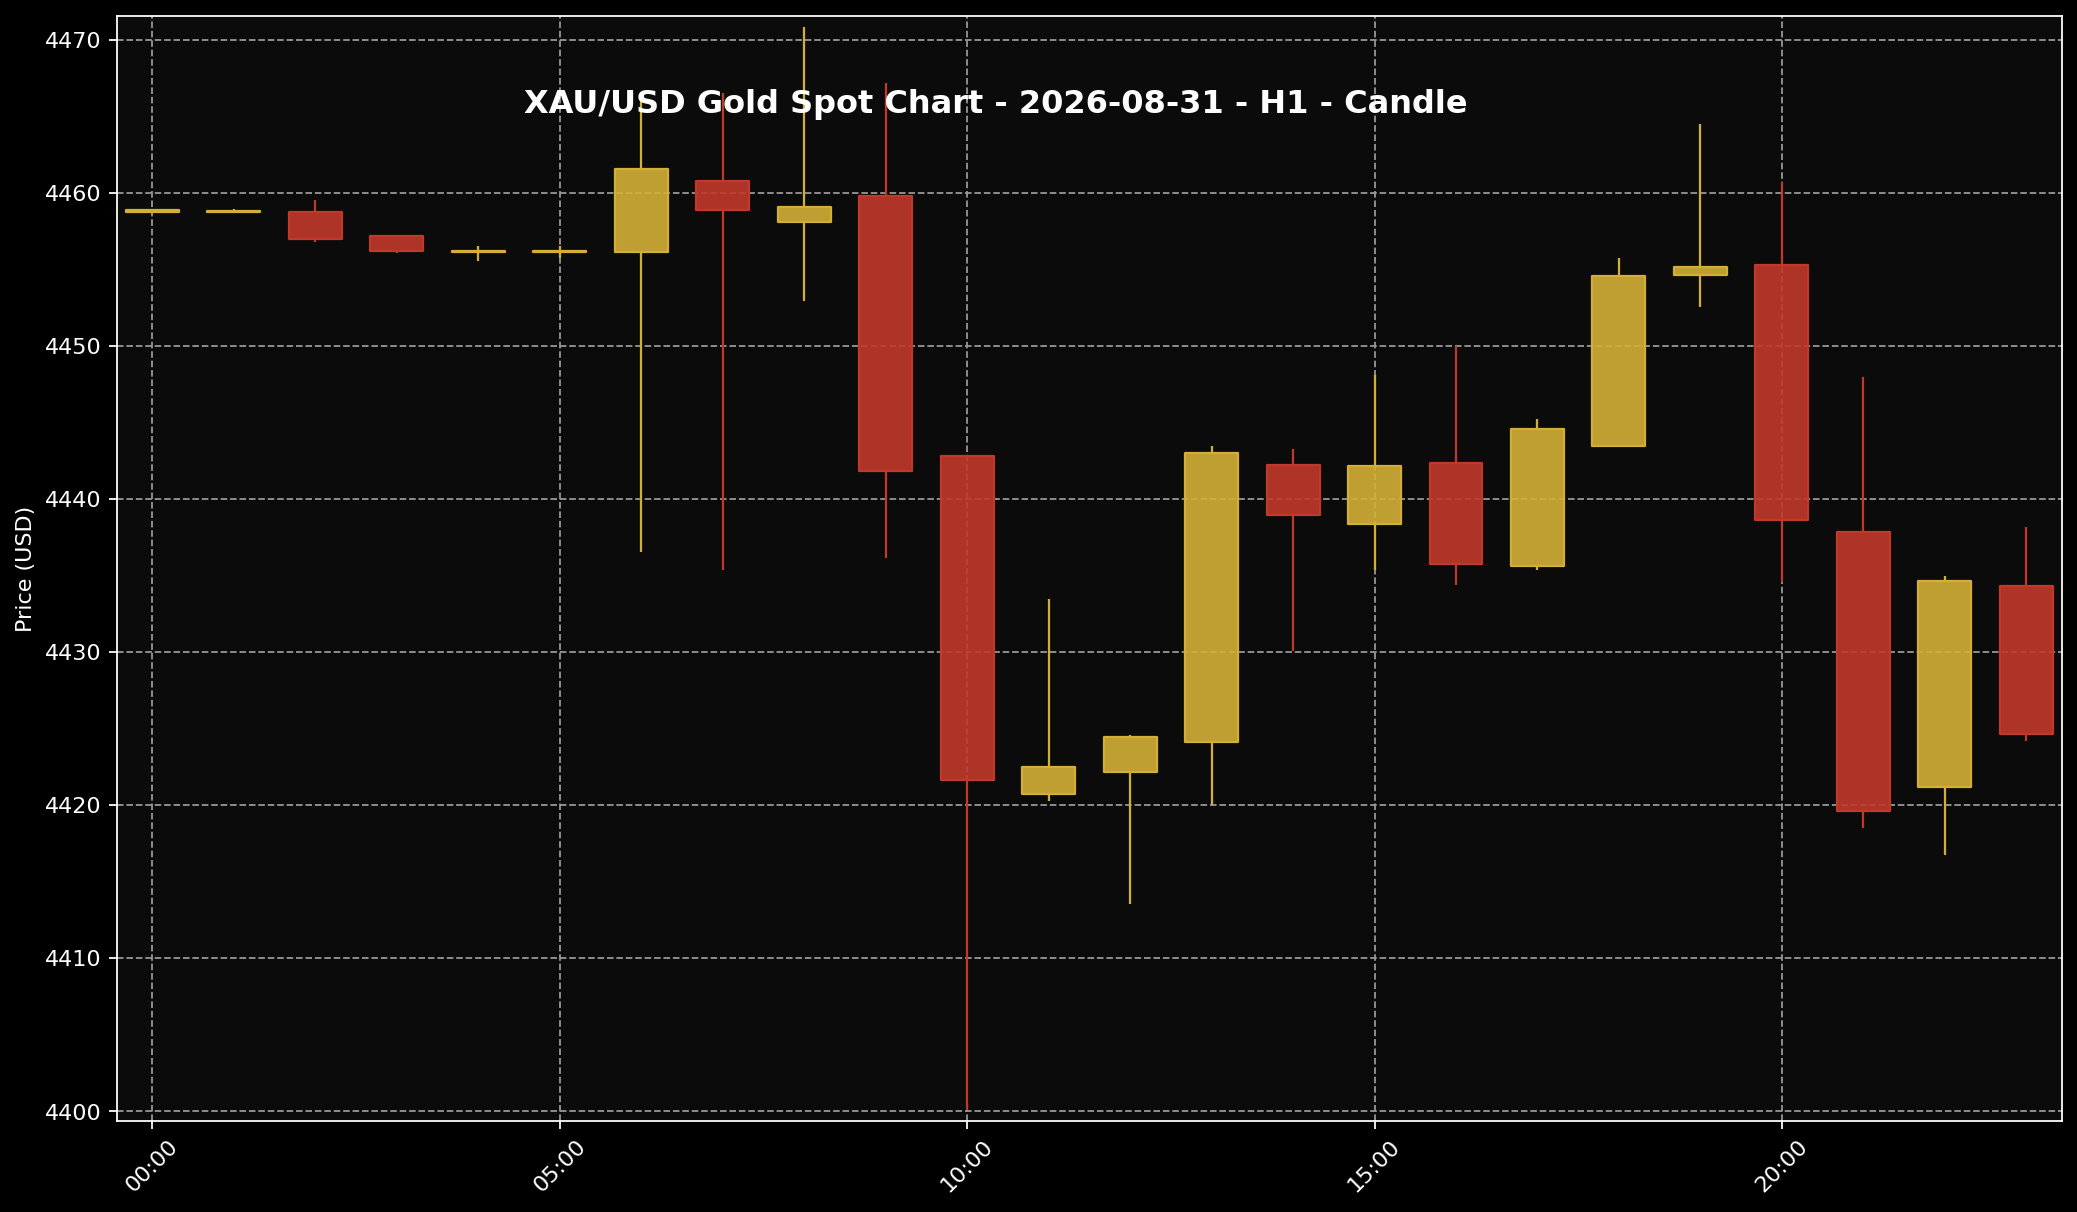 This chart helps readers see the gold price structure for the 31 August 2026 market session. It is used as market context and price-structure reference only.
1. Looking at the H1 gold chart for 31 August 2026, gold started around the USD4,455 to USD4,460 area before the selling pressure became clearer. It later moved down towards the lower USD4,410 to USD4,420 area. That tells us the market was not just drifting slightly lower. There was a real pressure phase during the session.
2. After that drop, gold tried to recover back towards the USD4,450 to USD4,455 area. But the rebound did not really hold until the end of the session. When price manages to bounce but cannot stay near the higher area, it usually tells us the market is still not strong enough to build a clean recovery.
3. By the 11:00 PM Malaysia time snapshot, the final H1 candle closed around USD4,424.66, close to the lower part of that hour’s range. From a simple market-structure view, gold still looked pressured into the late session. This is not a buy or sell signal. It is only a way to understand that gold had not fully escaped the pressure of the day.
Why Did Gold Move This Way?
 The US dollar is often one of the key factors influencing gold prices. When the dollar is firmer, gold can face more noticeable pressure.
1. The main reason came from the US rate story. When traders start thinking the Fed may stay firm on inflation, gold usually feels the pressure. The reason is simple. Investors compare gold with other assets such as US bonds. Bonds can pay a return. Gold is more about storing value and acting as protection, not earning interest.
2. The Warsh-related Fed tone added to that pressure. When the market believes US rates may stay higher for longer, the US dollar and US bond yields can get support. That makes it harder for gold to climb, because global gold is priced in US dollars. A stronger dollar can make the same gold price feel more expensive for buyers using other currencies.
3. At the same time, the Strait of Hormuz and US-Iran tension made the story more mixed. Geopolitical risk can support gold because some investors want protection when the world feels less stable. But if oil prices jump and inflation risk rises, the market may also think the Fed needs to stay strict for longer. So gold was caught between two forces: safe-haven demand was still there, but rate pressure carried more weight that day.
What Does This Mean For Gold Savers?
 For Malaysian gold savers, the key point is to understand the gap between global spot price and local physical price, then act according to budget and discipline.
1. For Malaysian gold savers, I would read this as a market-checking day, not a day to react purely by emotion. The key point is that global gold was being pressured by the Fed rate story. So if the price looked lower, the better question is: did gold lose its long-term role, or was the market simply adjusting its view on US interest rates? For me at Sifu Gold, that difference matters.
2. Another point is very important for Malaysia: global spot gold is not the same as local physical gold pricing. The RM572.67 per gram figure is only a global spot conversion based on USD/MYR around 4.02565. Local physical gold can be different because of premiums, buy-sell spread, product structure, operating cost, logistics and local pricing. So it is better not to compare XAU/USD one-to-one with the price seen at a shop or on a local gold platform.
3. If you already have a monthly gold-saving budget, a more disciplined approach is to buy bit by bit according to what you can afford. Do not go in heavily all at once just because gold dropped for one day. If your budget is tight, there is no need to force it. Check your commitments, emergency fund and savings plan first. To me, building grams consistently with a clear budget makes more sense than trying to catch the lowest price every time.
Conclusion
In short, gold on 31 August 2026 came under pressure because the market moved back to the Fed rate-risk story. Reuters reported gold slipping near a two-week low on Fed rate-hike bets, while Kitco highlighted Warsh repricing, the Strait of Hormuz, oil risk and US-Iran tensions as extra layers behind the move. For Malaysian gold savers, the useful takeaway is simple. Look at the global price, translate it into Ringgit, then compare it properly with local physical pricing. If your budget is already set, staged buying can still fit a long-term saving plan. If you are not ready yet, check your own cash flow first. Gold Accumulation Program by Public Gold allows gold saving to start from as low as RM100, which can suit those who want to build grams gradually without chasing one daily price.

