


What happened to gold on 31 July 2026? Gold had a chance to continue its earlier rebound after softer US PCE inflation data. But that strength did not last. As the US dollar regained strength and US Treasury yields stayed elevated, gold came under pressure again. For Malaysian gold savers, the story is not just that gold fell. The more useful point is why it happened, what the global price looks like in Ringgit, and how to read the move without reacting from one day’s price alone.
- Introduction
- What Happened To Gold On 31 July 2026?
- What Is The Gold Chart Showing?
- Why Did Gold Move This Way?
- What Does This Mean For Malaysian Gold Savers?
- What Practical Action Makes More Sense?
- Conclusion
What Happened To Gold On 31 July 2026?
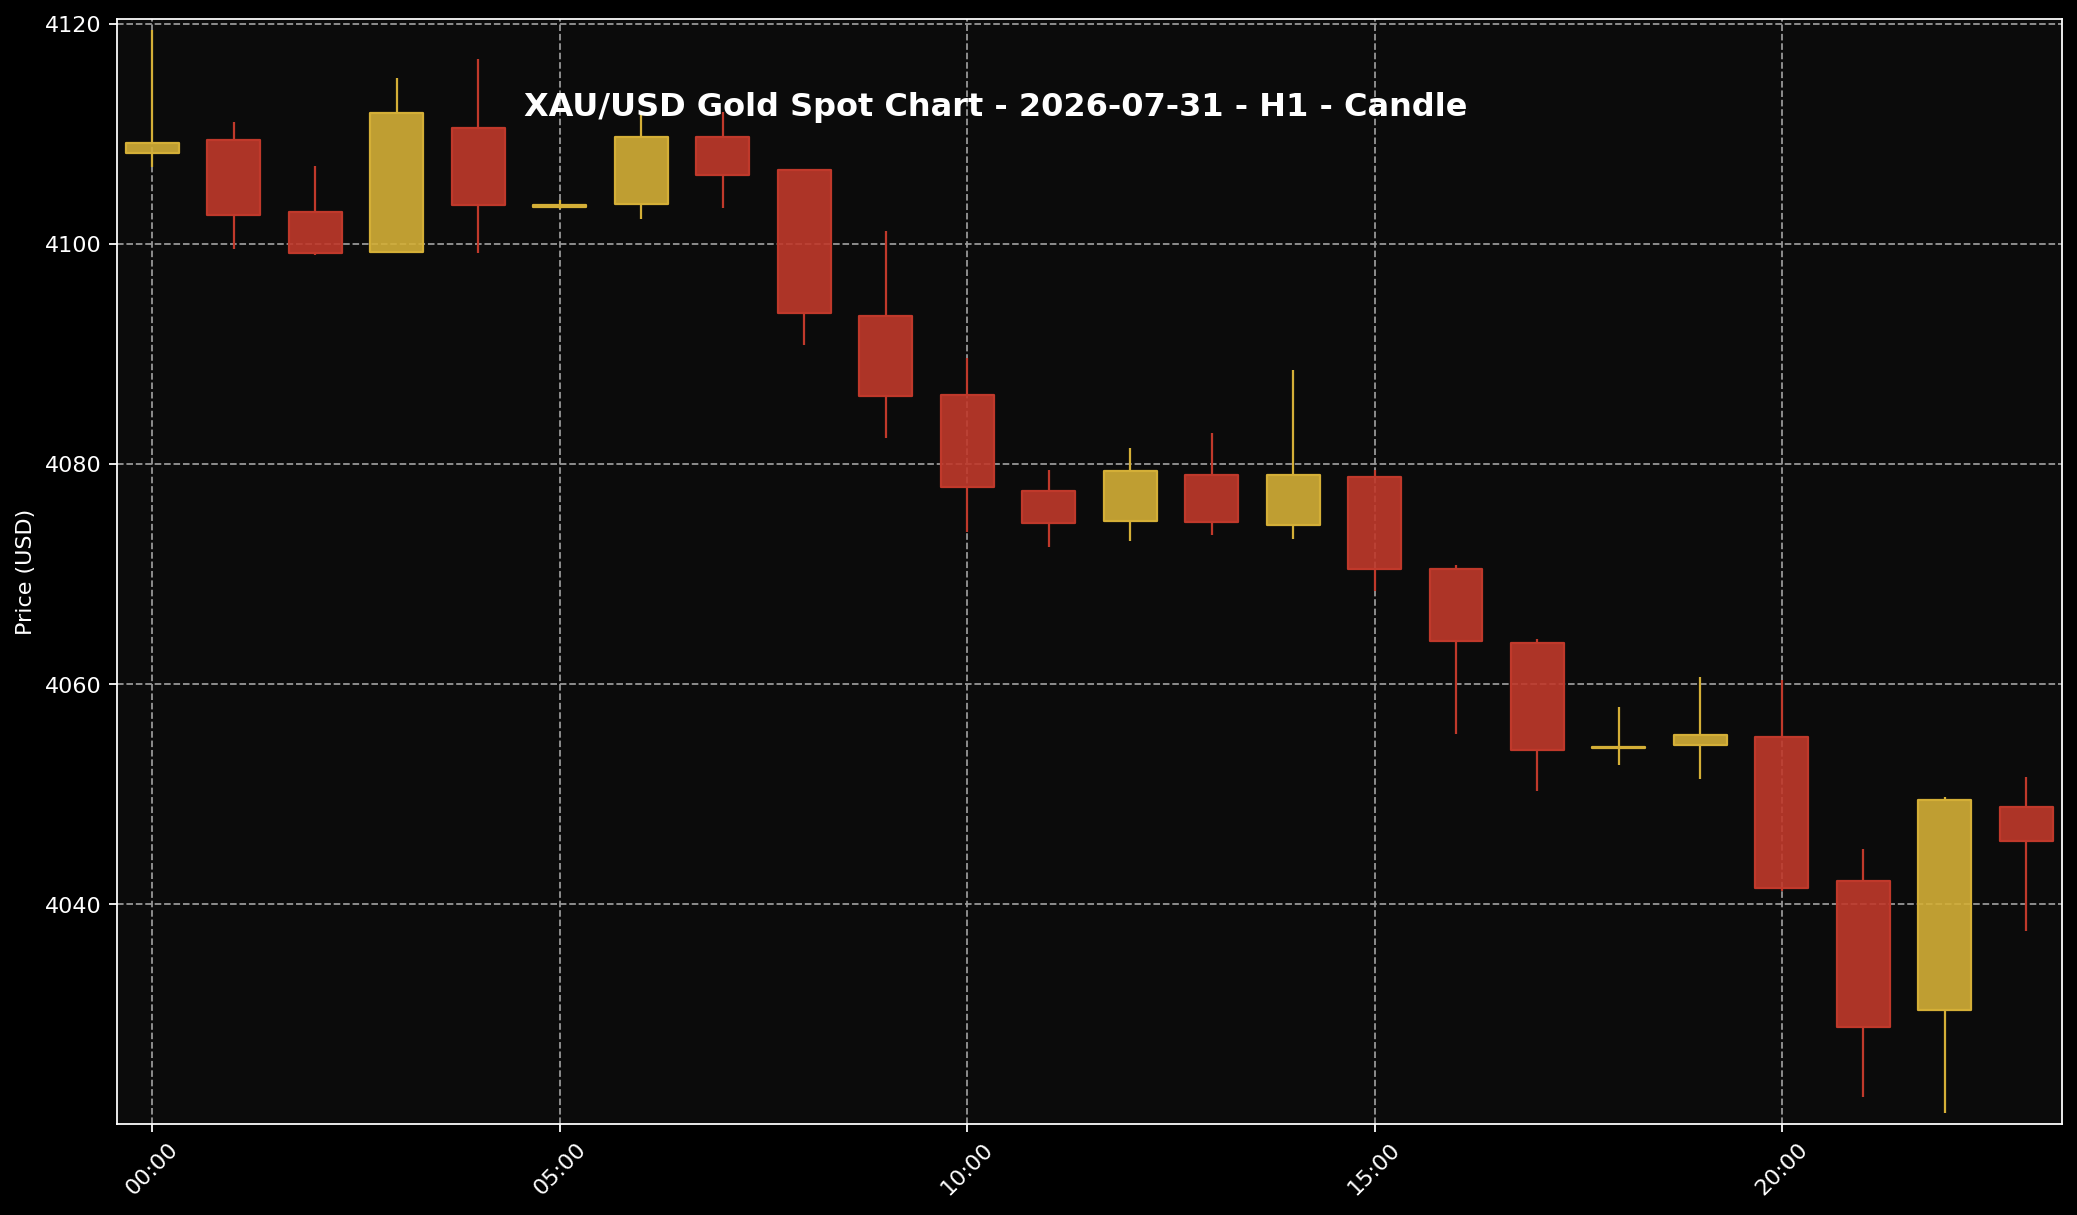 This chart shows the XAU/USD movement for the 31 July 2026 market session. Sifu Gold uses it as a visual reference, not a cue to buy emotionally.
1. At around 11:00 PM Malaysia time, global spot gold was around USD4,045.72 per troy ounce. If we break that down into grams, it was about USD130.07 per gram. Using the USD/MYR rate of around 4.08504 at the same reference time, that works out to roughly RM16,526.93 per troy ounce, or about RM531.35 per gram.
2. These Ringgit figures are global spot conversions only. They are not the same as local physical retail gold prices in Malaysia. Physical gold pricing can include other layers such as currency movement, product premium, buy-sell spread, product structure, operating cost, logistics and the local pricing method used by the seller.
3. The main story was quite clear. Gold came under pressure after the US dollar regained strength and US Treasury yields stayed elevated. Kitco’s market coverage also showed gold trading around the USD4,050 to USD4,057 area during the session, with pressure coming from the stronger dollar, elevated yields and firmer oil prices. So for me, this was not a clean recovery day. It looked more like a rebound that got blocked before it could continue properly.
What Is The Gold Chart Showing?
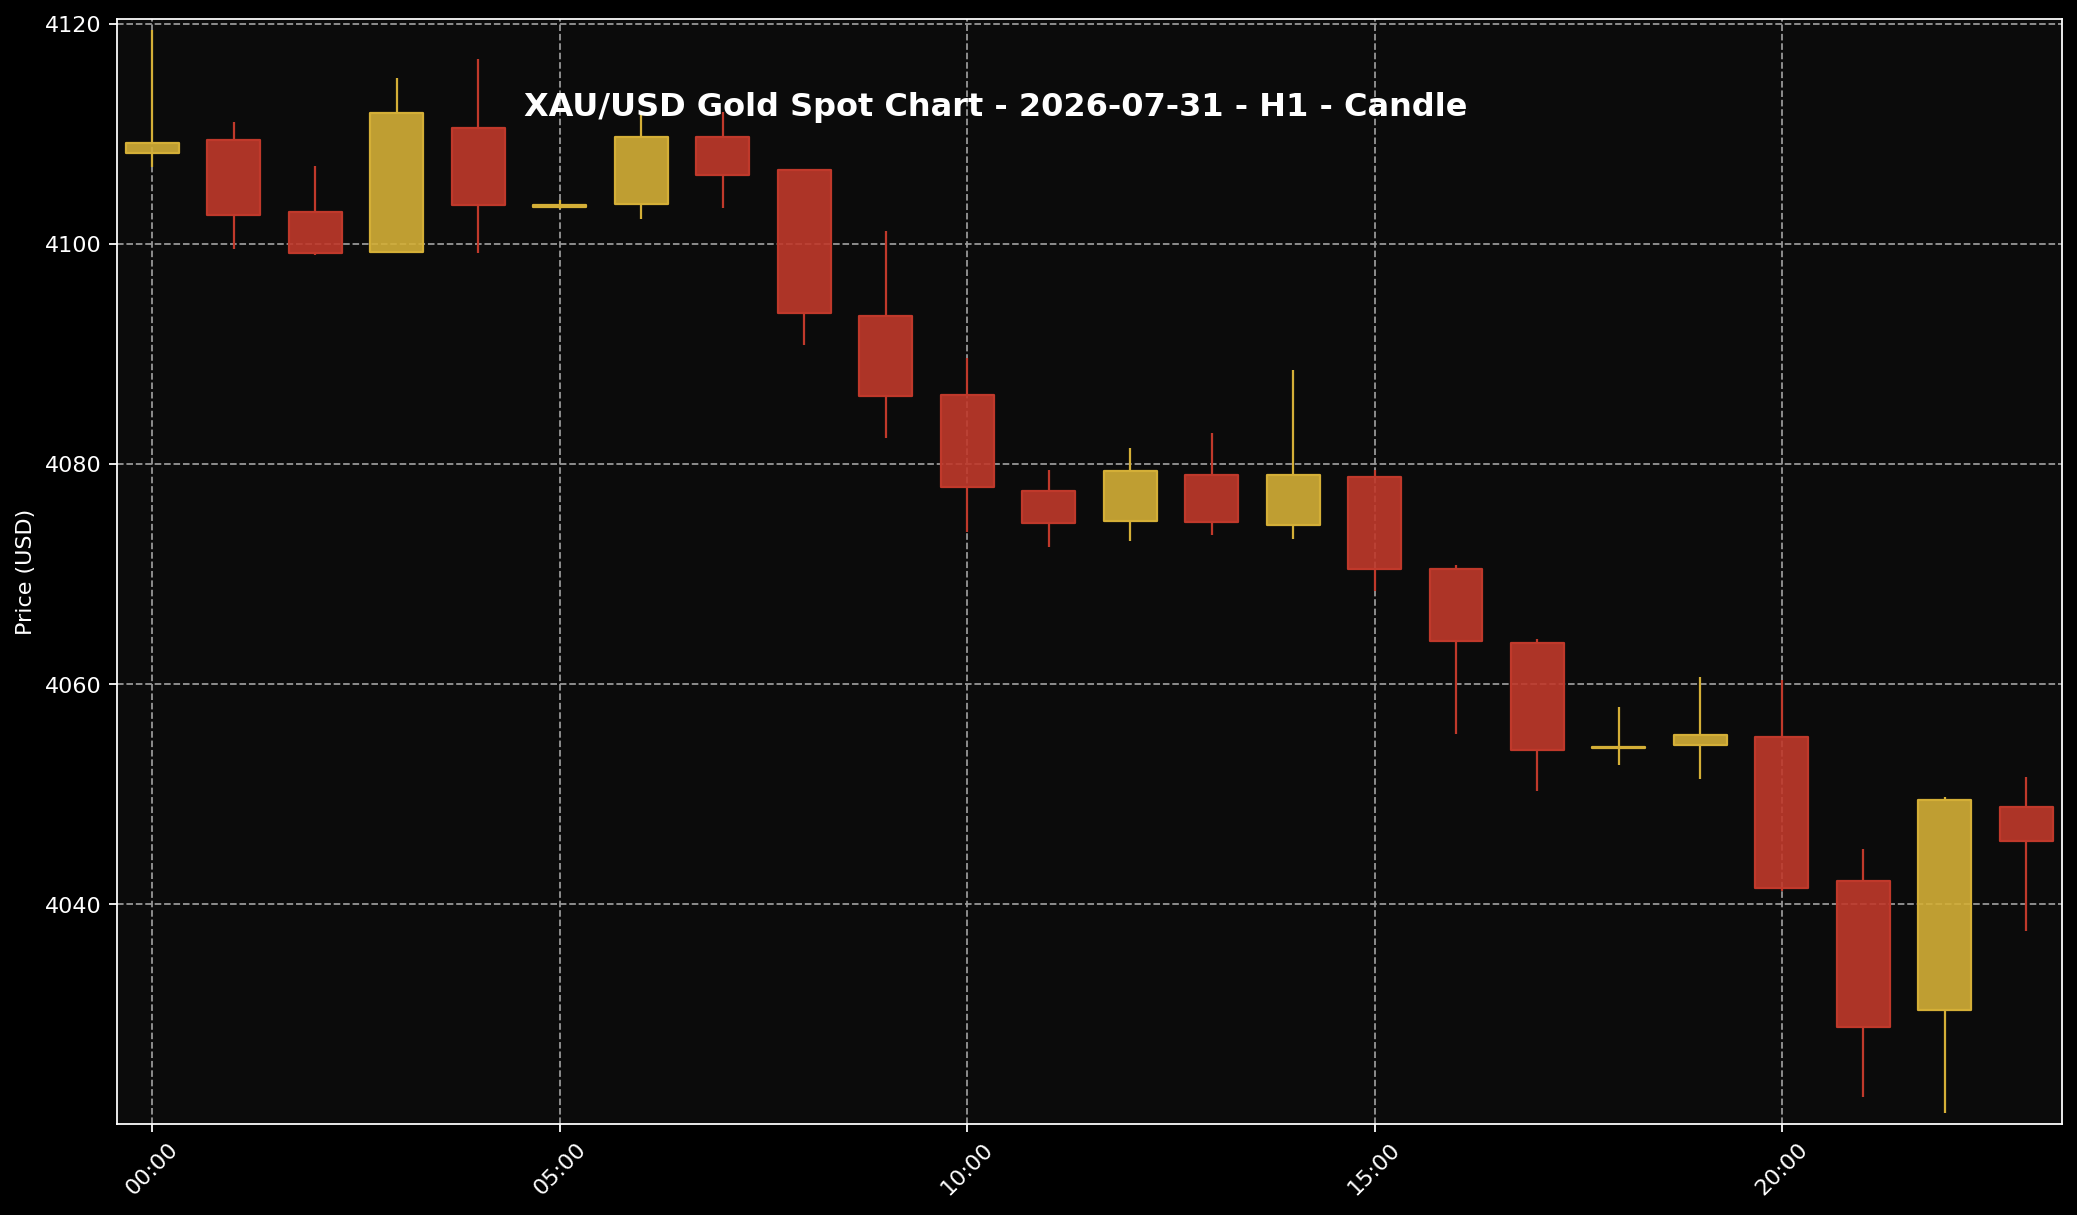 This chart helps readers see the gold price structure for the 31 July 2026 market session. It is used as market context and price-structure reference only.
1. If we look at the H1 gold chart for 31 July 2026, gold started the session near the upper area around USD4,100. Early on, it still looked like the market was trying to hold that higher zone. But as the session moved on, selling pressure became clearer, and the price moved lower towards the USD4,045 area by the later reference point.
2. Put simply, buyers did not have enough strength to keep gold near the top. The area around USD4,100 still looked difficult for gold to clear that day. Once gold could not stay near that upper zone, the market started to drift lower and search for a more comfortable level below it.
3. This is not a buy or sell instruction. I would read the chart only as a simple market structure story. The chart showed short-term pressure, even though the wider monthly picture was not completely negative. Reuters’ market coverage pointed out that gold was still on track for a better monthly performance after the earlier losing streak. So the daily tone was weaker, but the bigger picture was not a collapse.
Why Did Gold Move This Way?
 The US dollar is often one of the key factors influencing gold prices. When the dollar is firmer, gold can face more noticeable pressure.
1. The biggest pressure came from the US dollar. Global gold is priced in USD. When the US dollar becomes stronger, buyers using other currencies may find gold more expensive. When that happens, demand can become less aggressive, and gold can find it harder to keep moving higher.
2. The second layer was US Treasury yields. A Treasury yield is basically the return investors can get from holding US government bonds. If those yields stay attractive, some investors may prefer assets that pay a return instead of holding gold, which does not pay interest. That is why higher yields can make gold struggle, especially in the short term.
3. The story also connects back to US PCE inflation data. Softer PCE data had given gold some support earlier because the market saw room for the Federal Reserve to be less aggressive later on. But that support was not strong enough to carry gold higher through the whole session. Once the dollar and yields came back into focus, gold lost part of that earlier support.
What Does This Mean For Malaysian Gold Savers?
 For Malaysian gold savers, the key point is not only whether prices rise or fall. What matters more is budget, discipline and a clear purpose.
1. For Malaysian gold savers, I would not read 31 July 2026 as simply “gold fell, so the story is bad”. The more useful reading is this: gold is still very sensitive to the US dollar, US yields and expectations around US interest rates. When these three things move, global gold can react quickly, even if the long-term case for holding some gold still has its place.
2. The Ringgit angle also matters. The global spot reference of about RM531.35 per gram helps Malaysian readers see what the USD gold price looks like after conversion. But local physical gold prices will not always move one-to-one with that number. USD/MYR, premium, spread, product structure and local pricing can all change what buyers actually see in Malaysia.
3. So if someone is saving physical gold, looking at XAU/USD alone is not enough. The better question is: what is the plan? Is the gold being kept for long-term saving, or is the person trying to react to every daily move? For long-term gram building, one weaker or stronger day should not be the only reason to change the whole plan.
What Practical Action Makes More Sense?
 When gold prices move quickly, better decisions usually come from disciplined planning, not panic reactions.
1. The way I see it at Sifu Gold, a day like this is better used to review the plan. If there is already a monthly budget set aside for gold, small staged purchases can still be considered according to affordability. This approach is easier to manage than trying to guess the lowest price of the day.
2. If the budget is tight, there is no need to force it. Do not go in heavily all at once just because global spot gold moved lower for one session. Home commitments, family needs, debt payments, emergency savings and monthly cash flow should still come first. Gold is a savings tool, not a reason to disturb basic financial stability.
3. If the market still feels unclear, waiting and reviewing the numbers is also a disciplined choice. Watch the US dollar, US Treasury yields, USD/MYR and local physical gold prices. The point is not to be the fastest person to react. The point is to keep building grams in a way that does not damage your own budget.
Conclusion
The conclusion for 31 July 2026 is simple. Gold came under pressure because the earlier support from softer US PCE inflation was not strong enough to beat a firmer US dollar and still-elevated US Treasury yields. The H1 chart also showed gold failing to hold the upper area around USD4,100 before moving down towards the USD4,045 region near the later reference point. For Malaysian gold savers, the more useful focus is not chasing one day’s price movement. It is better to understand the difference between global spot gold and local physical pricing, then act according to budget. If the budget is already there, building grams little by little can still make sense. If the budget is not ready, review first. For those just starting, the Gold Accumulation Program by Public Gold allows you to begin saving gold from as low as RM100, which can be a practical way to build grams gradually according to your own affordability.

