


What happened to gold on 5 September 2026? For this date, the better way to read the market is as a weekend reference, not a fresh full trading session. The latest available price still points back to the completed session on 4 September, when stronger US jobs data changed the mood. That data brought the Fed rate story back into focus, supported the US dollar and Treasury yields, and made gold look more pressured before the weekend.
- Introduction
- What Happened To Gold On 5 September 2026?
- What Is The Gold Chart Showing?
- Why Did Gold Move This Way?
- What Does This Mean For Gold Savers?
- Conclusion
What Happened To Gold On 5 September 2026?
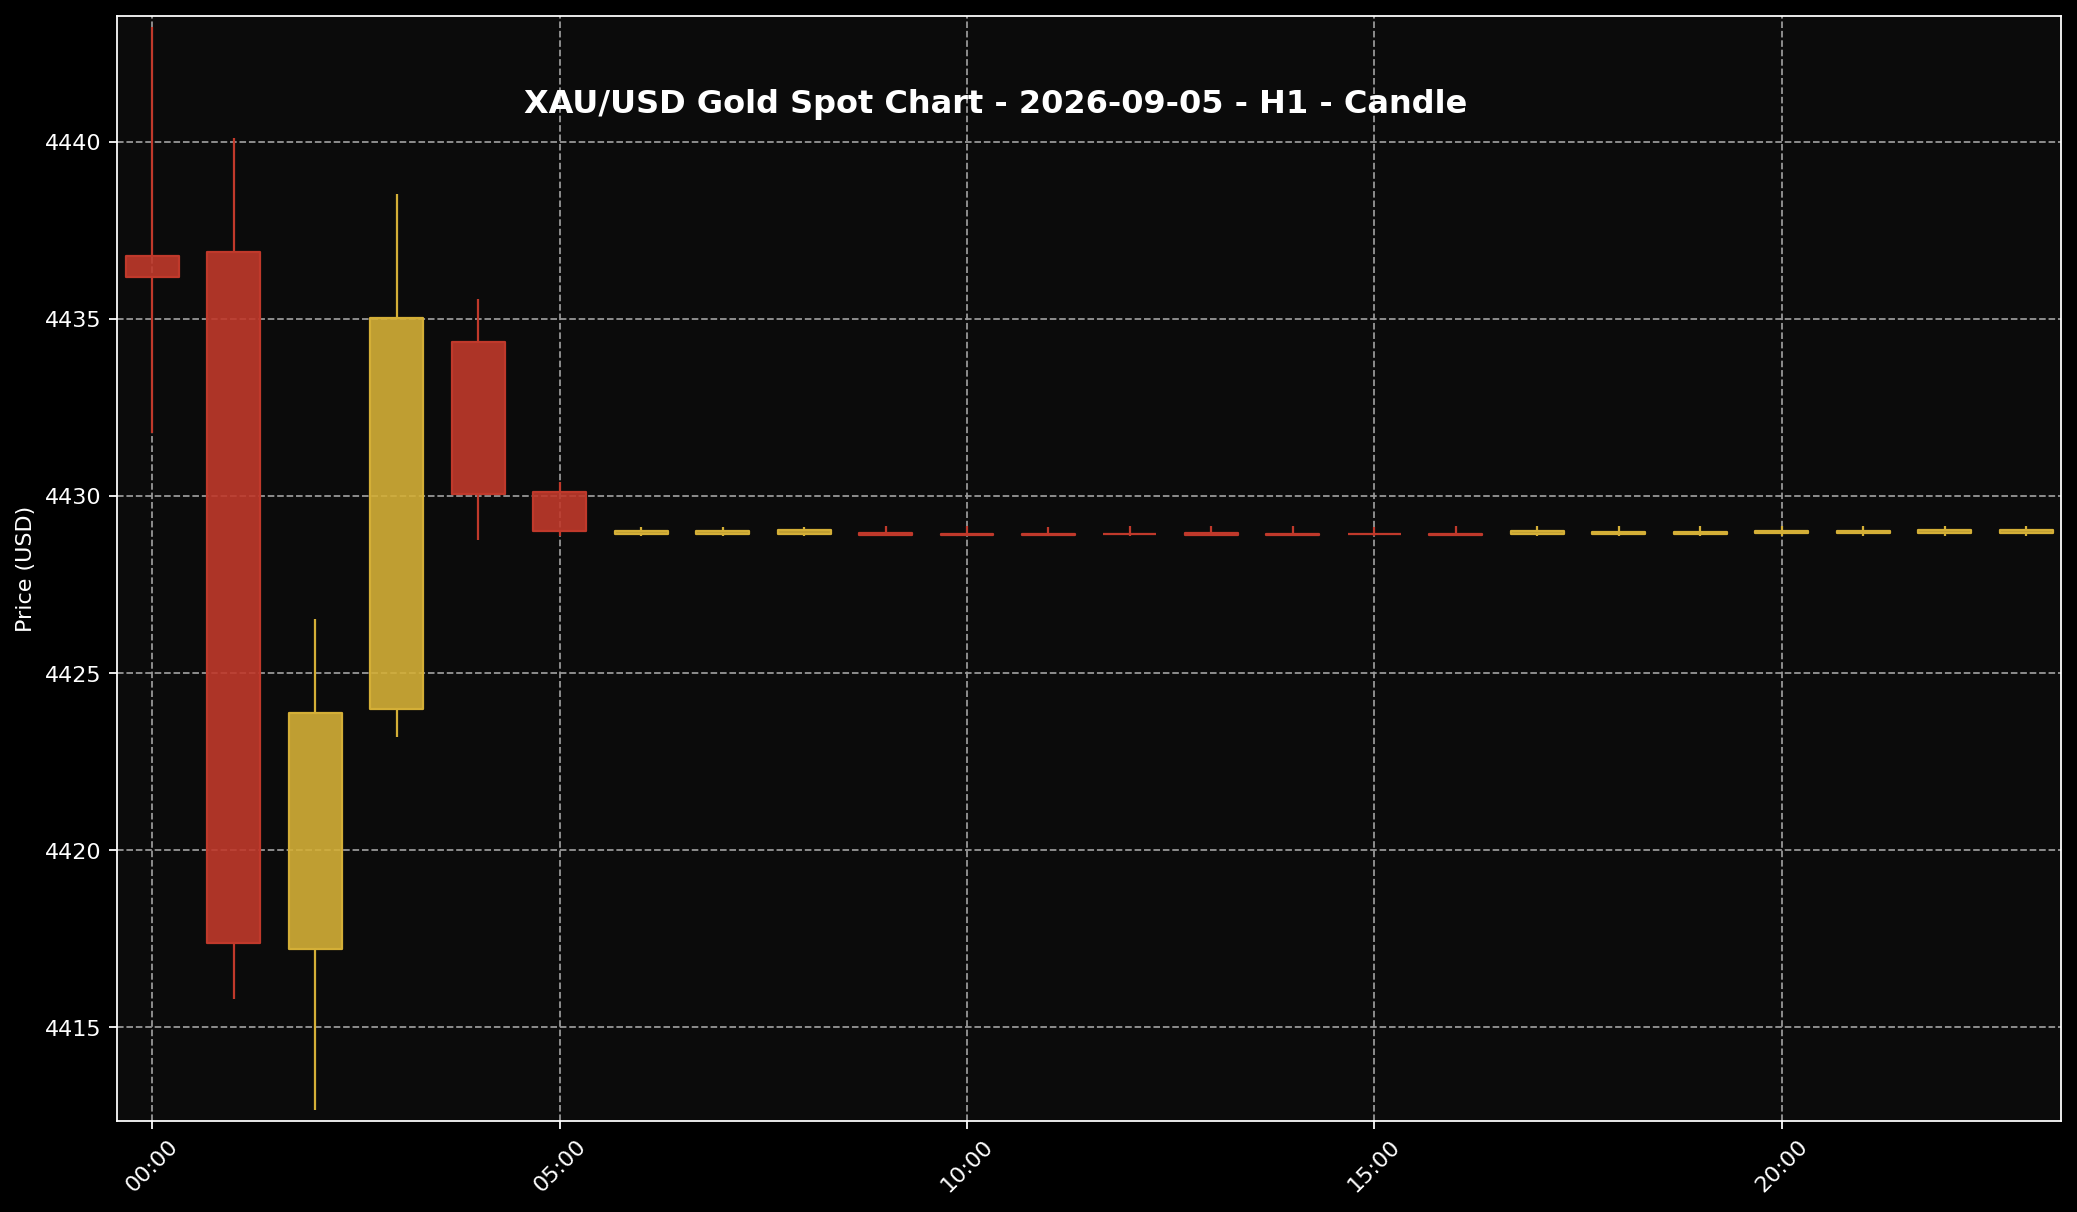 This chart shows the XAU/USD movement for the 5 September 2026 market session. Sifu Gold uses it as a visual reference, not a cue to buy emotionally.
1. For 5 September 2026, gold should be read as a weekend reference price. Around 11:00 PM Malaysia time, XAU/USD was around USD4,429.04 per troy ounce. That works out to about USD142.40 per gram. Using USD/MYR at around 4.04462, the same global spot reference becomes roughly RM17,913.80 per troy ounce, or about RM575.94 per gram.
2. Those Ringgit numbers help Malaysian readers see the picture more clearly. But they are still only a conversion of global spot gold into Ringgit. They are not the same as local physical gold prices in Malaysia. Physical gold prices can include other parts such as premium, buy-sell spread, product type, operating cost and local pricing structure.
3. The main story was not that gold found a strong new direction on Saturday. The market was already in weekend mode. The latest reference still carried the pressure from the completed 4 September session, when stronger-than-expected US jobs data made traders rethink how long US rates might stay high.
What Is The Gold Chart Showing?
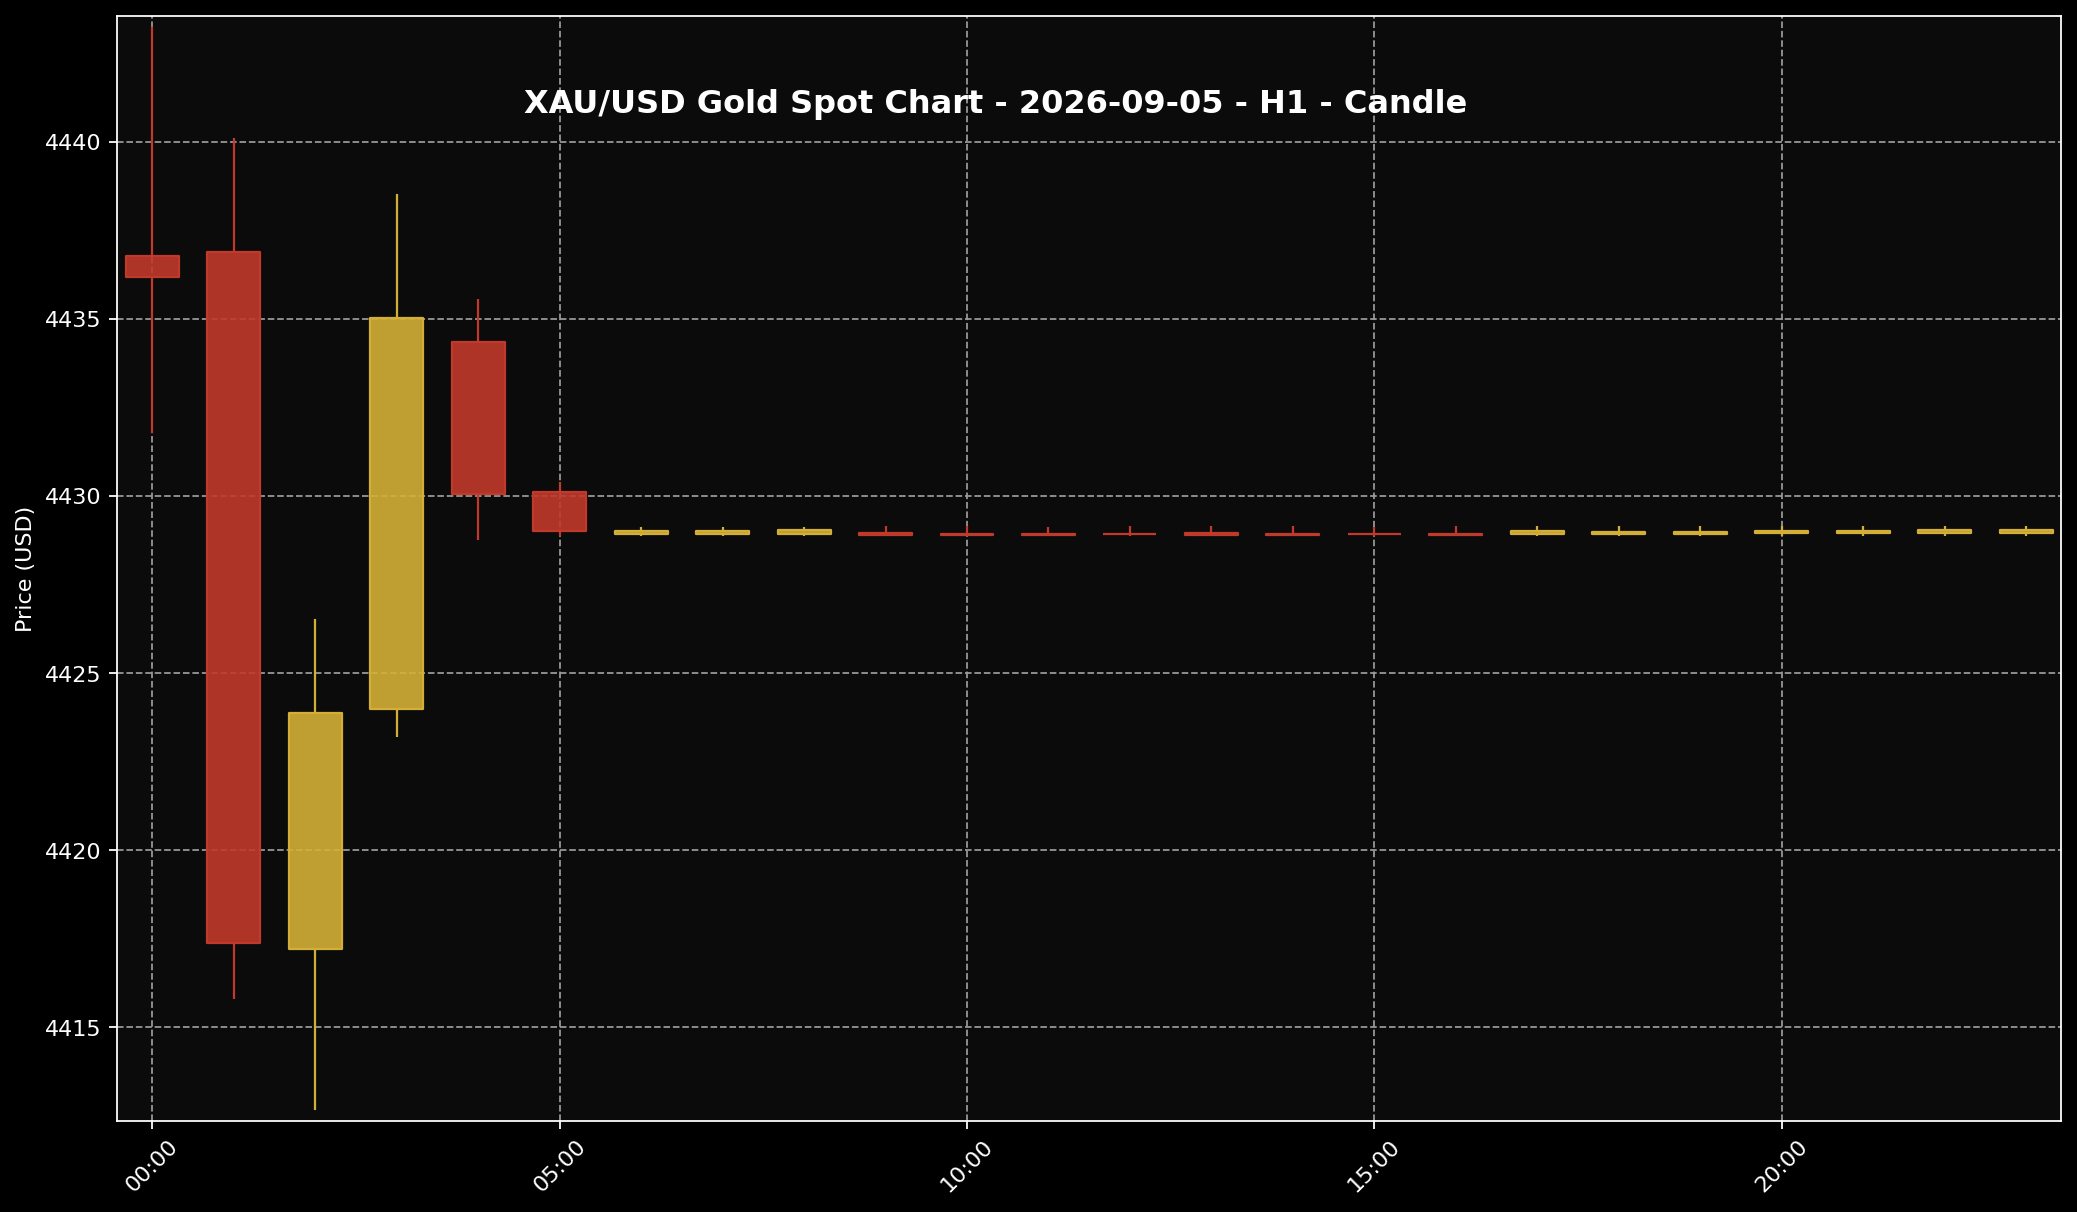 This chart helps readers see the gold price structure for the 5 September 2026 market session. It is used as market context and price-structure reference only.
1. The H1 gold chart showed gold moving through a wider range earlier, roughly from the USD4,412 area towards the upper USD4,440 area. In simple terms, the market had already been shaken by the US jobs story, and prices were still trying to find a fair level after that move.
2. After that bigger move, the candles became much smaller and sat closer to the USD4,429 area. That tells us the market was not running far in one direction anymore. It looked more like gold had paused around a reference zone while traders waited for the next proper clue.
3. The way I would read this at Sifu Gold is simple: the chart is useful as a map, not a signal. Gold had been pressured, then it tried to recover part of the move. But there was not enough on the chart to say the bigger pressure had disappeared. For gold savers, this is more useful for reviewing the plan than chasing every hourly move.
Why Did Gold Move This Way?
 The US dollar is often one of the key factors influencing gold prices. When the dollar is firmer, gold can face more noticeable pressure.
1. The story starts with the stronger US jobs data from the completed 4 September session. When the jobs market looks stronger than expected, traders usually think the US economy can still handle higher rates. That can make the market less confident about quick rate cuts, and it can bring back the idea that the Federal Reserve may keep policy tighter for longer.
2. Once the US rate story becomes stronger, two things often matter for gold: the US dollar and Treasury yields. A stronger US dollar can make gold more expensive for buyers outside the United States. Higher Treasury yields also matter because bonds start to look more attractive, while gold itself does not pay interest.
3. That is why gold can struggle even when the longer-term interest in gold is still there. Kitco’s gold coverage pointed to strong selling after the US jobs data, with a later attempt by gold to claw back some of the drop. Reuters-linked evidence for the completed session also supported the same broad story: robust payrolls revived rate expectations and weighed on gold.
What Does This Mean For Gold Savers?
 For Malaysian gold savers, the key point is to understand the gap between global spot price and local physical price, then act according to budget and discipline.
1. For Malaysian gold savers, the main point is this: do not read the 5 September price as a fresh weekend trading signal. It is better used as a reference point after the last completed session. Gold is still sensitive to US data, the Fed story, the US dollar and Treasury yields, so short-term price changes can still look sharp.
2. Also, global spot price and local physical gold price are not the same thing. The RM575.94 per gram reference is only the global spot conversion using XAU/USD and USD/MYR. Local physical gold may be higher because it can include premium, spread, logistics, product cost and the way local pricing is structured.
3. If you are thinking about adding more grams, start with the budget first. If you already have a monthly gold-saving plan, small gradual buying can make more sense than committing the full budget at once. If cash flow is tight or local prices still feel high, waiting and reviewing again next week can also be a disciplined decision.
Conclusion
For 5 September 2026, gold did not have a fresh full trading-session story because the global market was already in weekend mode. The latest reference still leaned on the completed 4 September session, where stronger US jobs data brought the Fed rate story, the US dollar and Treasury yields back into focus. For Malaysian gold savers, use this as a planning checkpoint. Look at the global spot price, translate it into Ringgit, then compare it with the real local physical price before deciding. The better focus is not to chase one price move, but to build grams according to budget. For those starting small, the Gold Accumulation Program by Public Gold allows gold saving from as low as RM100, which suits a gradual approach based on affordability.

