


What happened to gold on 6 September 2026? The new trading week was only just reopening, so it would not be fair to treat this date like a full completed session. For a Monday article looking at a Sunday market date, the fairest comparison is still the last completed Friday session on 4 September 2026. That was when stronger US jobs data pushed gold under pressure. For Malaysian gold savers, the useful part is not only whether gold moved up or down, but how this early price reference looks once translated into Ringgit.
- Introduction
- What Happened To Gold On 6 September 2026?
- What Is The Gold Chart Showing?
- Why Did Gold Move This Way?
- What Does This Mean For Gold Savers?
- Conclusion
What Happened To Gold On 6 September 2026?
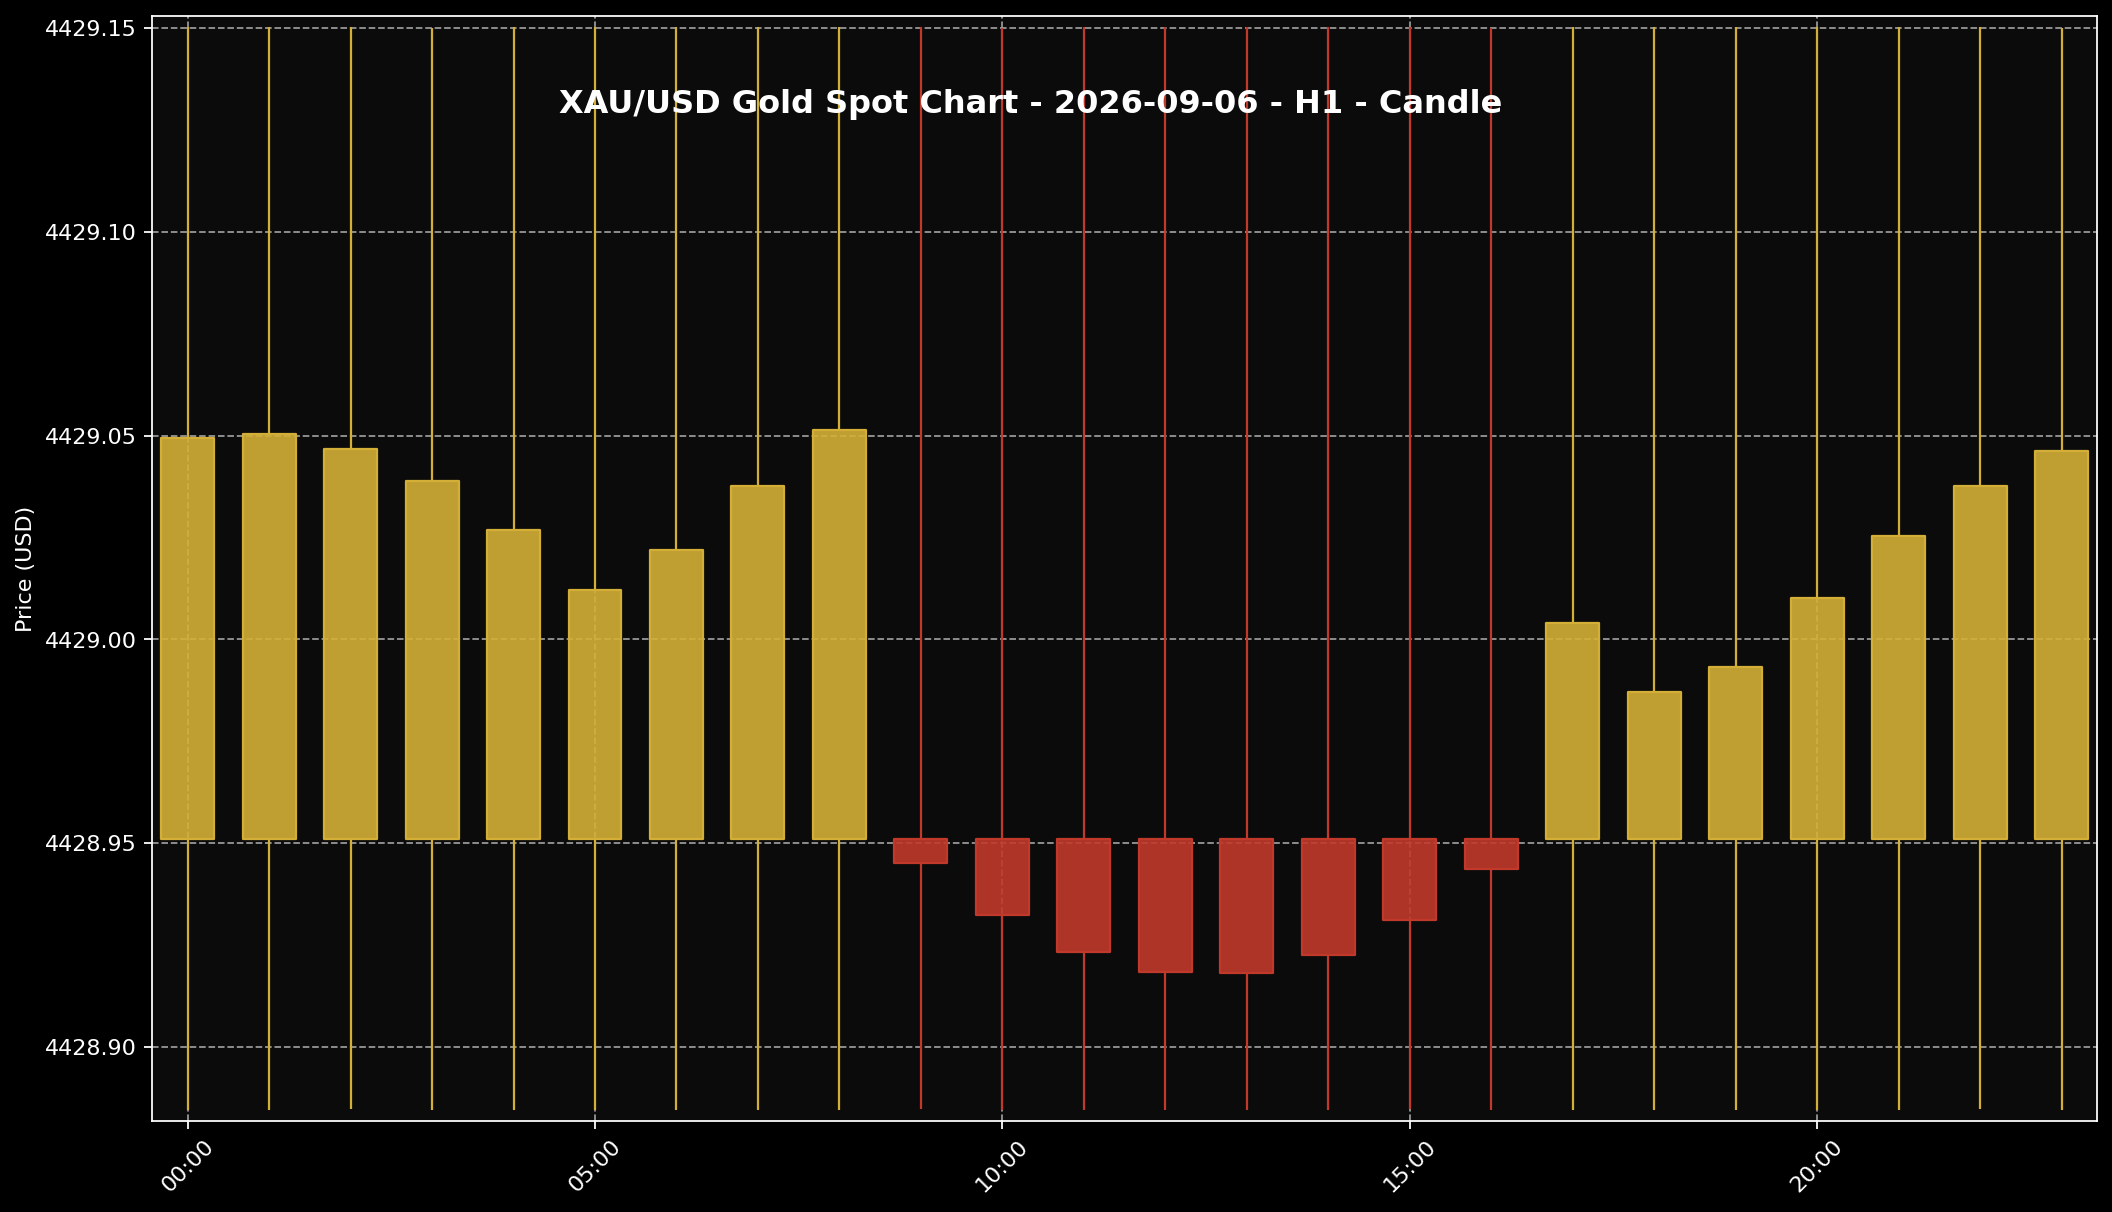 This chart shows the XAU/USD movement for the 6 September 2026 market session. Sifu Gold uses it as a visual reference, not a cue to buy emotionally.
1. Around 11:00 PM Malaysia time, the global spot gold reference was around USD4,429.05 per troy ounce. Converted into grams, that is about USD142.40 per gram. Using USD/MYR at around 4.0442, the same global spot reference works out to roughly RM17,911.90 per troy ounce, or about RM575.88 per gram. These Ringgit numbers are only global spot conversions. They are not the same as local physical retail gold prices in Malaysia.
2. For 6 September 2026, the safer way to read this is as an early reopening reference for the new trading week. The market had not yet given a full fresh session story strong enough to say that a clear new direction had already formed. That is why the comparison still goes back to Friday, 4 September 2026, the last completed session.
3. On that Friday session, gold came under pressure after US jobs data came in stronger than expected. Kitco highlighted selling pressure after the US economy created 162,000 jobs in August, while Reuters-linked market coverage connected the fall in gold to stronger payrolls and changing expectations around Federal Reserve rates. So the Sunday reference is better understood as gold entering a new week with Friday’s pressure still in the background.
What Is The Gold Chart Showing?
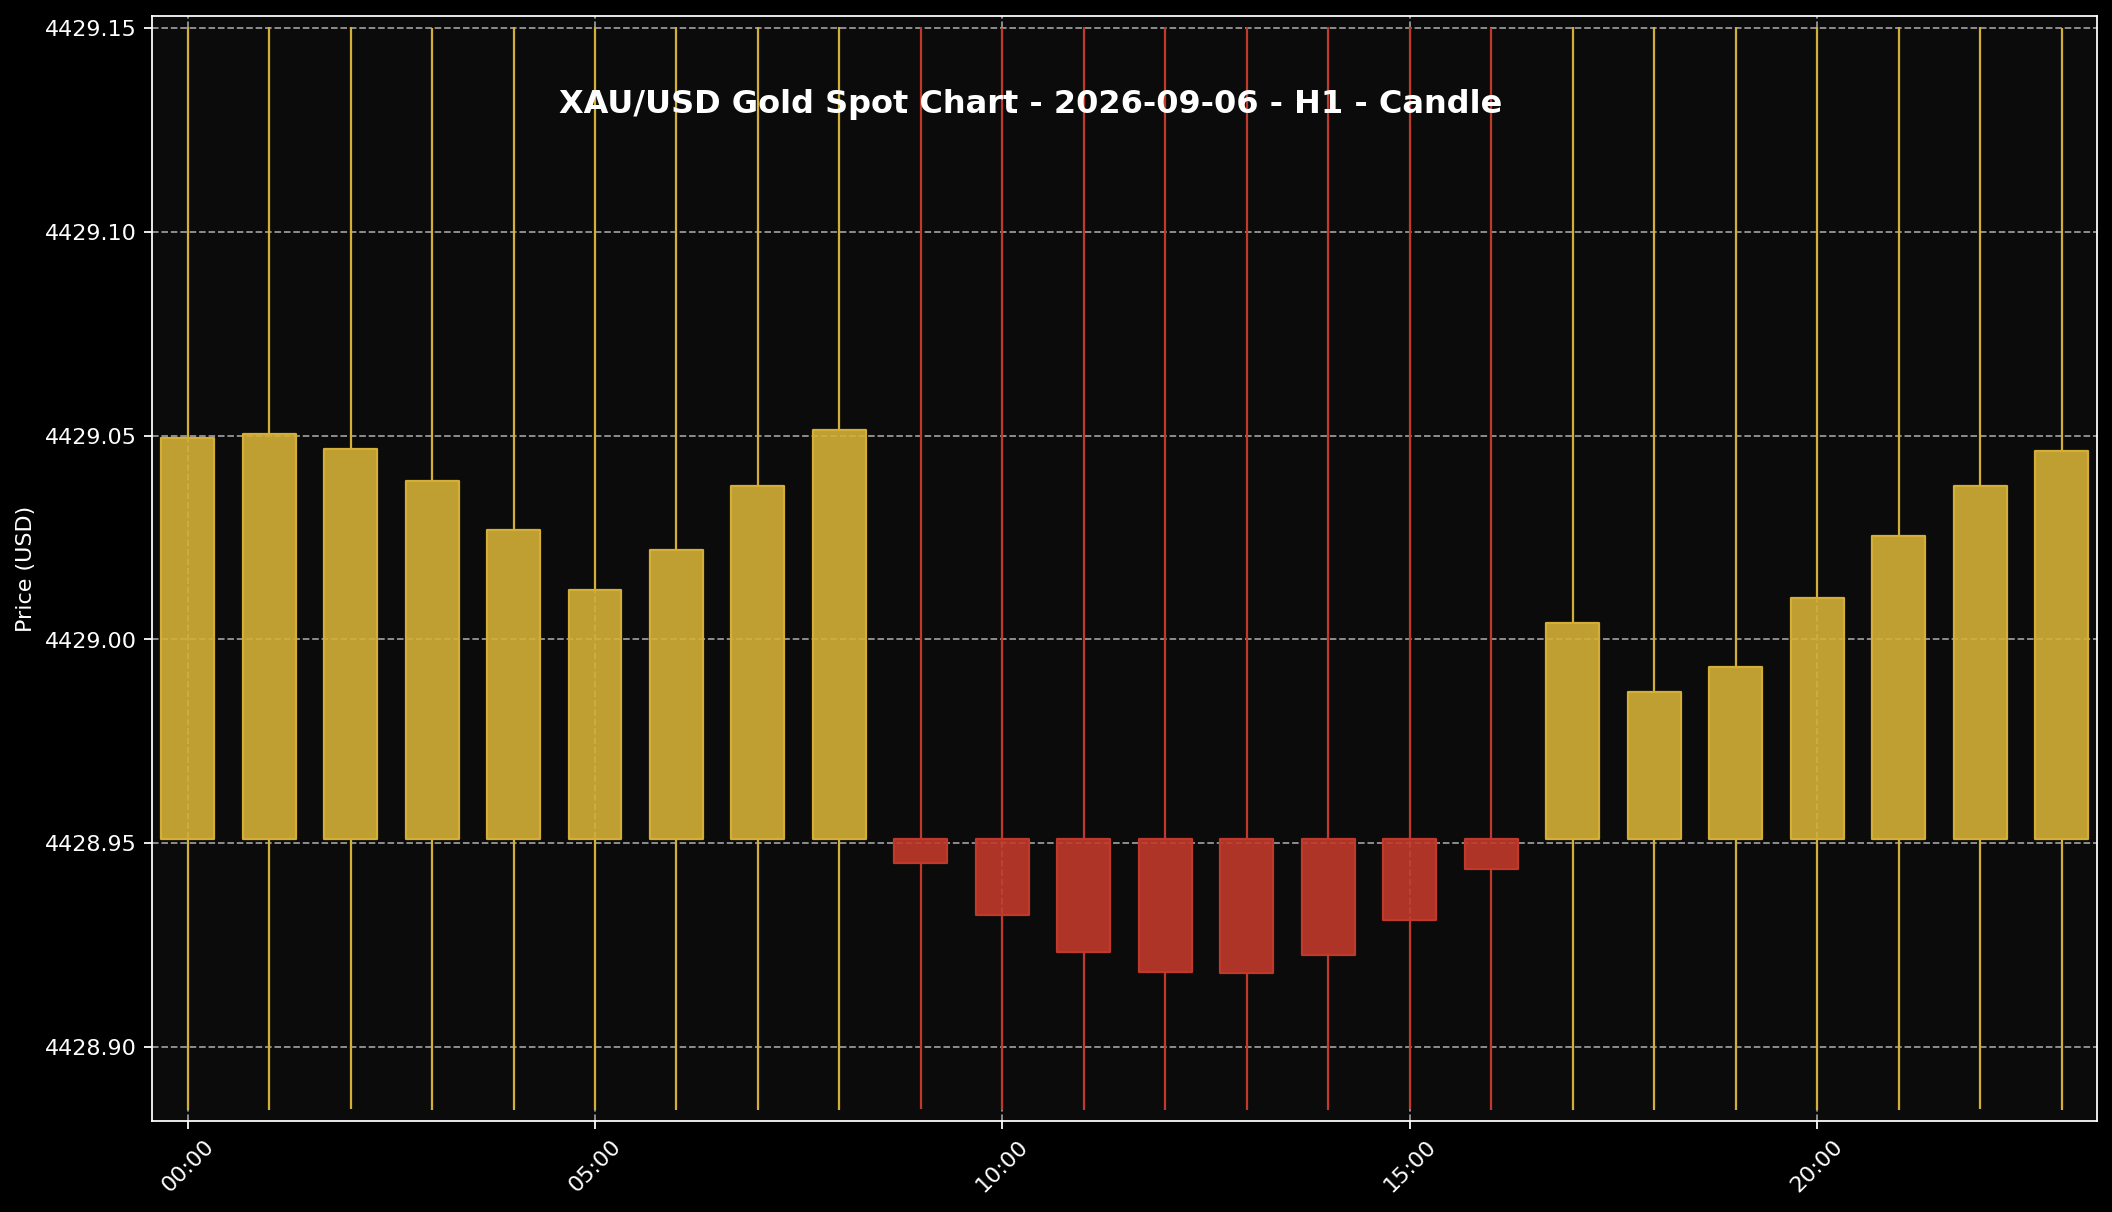 This chart helps readers see the gold price structure for the 6 September 2026 market session. It is used as market context and price-structure reference only.
1. Looking at the H1 gold chart for 6 September 2026, price action looked narrow around the USD4,429 area. The candles were small, with a slight dip earlier and a small attempt to recover later. That does not look like a market that has already made a strong move in one direction. It looks more like a market settling into a small range while the new week gets started.
2. This kind of chart should not be treated as a trading signal. It simply shows that the market structure was still not giving a strong message. There was some pressure, then some recovery, but both happened inside a tight space. For me at Sifu Gold, this is more useful as a checking point: is gold continuing Friday’s pressure, or is the market waiting for a clearer reason to move?
3. The main takeaway is simple. Gold had not shown enough movement on the Sunday reference to over-explain the day. When a new week is still early, the market often waits for the next data point or the next major headline before choosing a clearer direction. So this article is not a price forecast. It is a way to understand why gold still looked like it was searching for direction.
Why Did Gold Move This Way?
 The US dollar is often one of the key factors influencing gold prices. When the dollar is firmer, gold can face more noticeable pressure.
1. The main story still comes from the completed Friday session. Stronger US jobs data made the market rethink the path of Federal Reserve interest rates. The Fed is the central bank of the United States. When the US economy looks stronger, traders may feel the Fed has more room to keep rates high, or to stay more aggressive against inflation.
2. When rate expectations shift that way, US Treasury yields can rise and the US dollar can become firmer. Put simply, investors may see other assets, such as bonds, as more attractive because gold does not pay interest. At the same time, gold is priced in US dollars. When the dollar strengthens, buyers outside the United States have to pay more in their own currency for the same gold. That can reduce buying appetite in the short term.
3. That is why gold can look pressured even when longer-term interest in gold has not disappeared. Kitco also showed that gold tried to claw back part of the jobs-driven selloff later, as markets looked ahead to inflation data. So the story is not that gold suddenly became weak across every angle. The more balanced view is this: gold entered the new week still sensitive to US data, the US dollar, Treasury yields and Fed expectations.
What Does This Mean For Gold Savers?
 For Malaysian gold savers, the key point is to understand the gap between global spot price and local physical price, then act according to budget and discipline.
1. For Malaysian gold savers, daily gold movement is better used as a checking tool, not as a reason to react emotionally. The 6 September 2026 reference shows that the market was still early in the new week. So it makes sense to watch whether Friday’s pressure really continues, or whether gold simply waits for the next clearer trigger.
2. One point matters a lot: global spot gold is not the same as local physical gold pricing. The RM575.88 per gram figure is a global spot conversion using USD/MYR around 4.0442. Physical gold prices in Malaysia can be different because of product premium, buy-sell spread, operating cost, logistics, product structure and the current Ringgit exchange rate.
3. If you already have a monthly gold-saving budget, the more disciplined approach is to follow your plan and buy gradually when it fits your cash flow. If this month’s budget is tight, there is no need to force it. I prefer readers to check their commitments, protect basic savings, understand the spread, and avoid committing the full budget at once just because one price reference looks interesting.
Conclusion
The conclusion for 6 September 2026 is quite straightforward. Gold had not yet produced a full fresh trading-session story because the new week was only just reopening. The fairest reference point remains Friday, 4 September 2026, when stronger US jobs data pressured gold through the Fed rate story, the US dollar and US Treasury yields. For Malaysian gold savers, use this kind of market reading to make decisions with better structure. Check the global spot price, look at USD/MYR, separate global spot conversion from local physical gold pricing, and then come back to your own budget. If you want to start small, the Gold Accumulation Program by Public Gold allows you to begin saving gold from as low as RM100, which can suit a gradual gram-building approach based on affordability.

