


What happened to gold on 7 September 2026? Gold came under pressure after the market read stronger US jobs data as a sign that the American economy was still holding up well. When jobs data looks strong, traders tend to think the Fed may have more room to keep interest rates high, especially if inflation has not cooled enough. For Malaysian gold savers, the useful point is not just that gold moved lower. It is why the move happened, what the chart showed, and how that global price looked once translated into Ringgit.
- Introduction
- What Happened To Gold On 7 September 2026?
- What Is The Gold Chart Showing?
- Why Did Gold Move This Way?
- What Does This Mean For Gold Savers?
- Conclusion
What Happened To Gold On 7 September 2026?
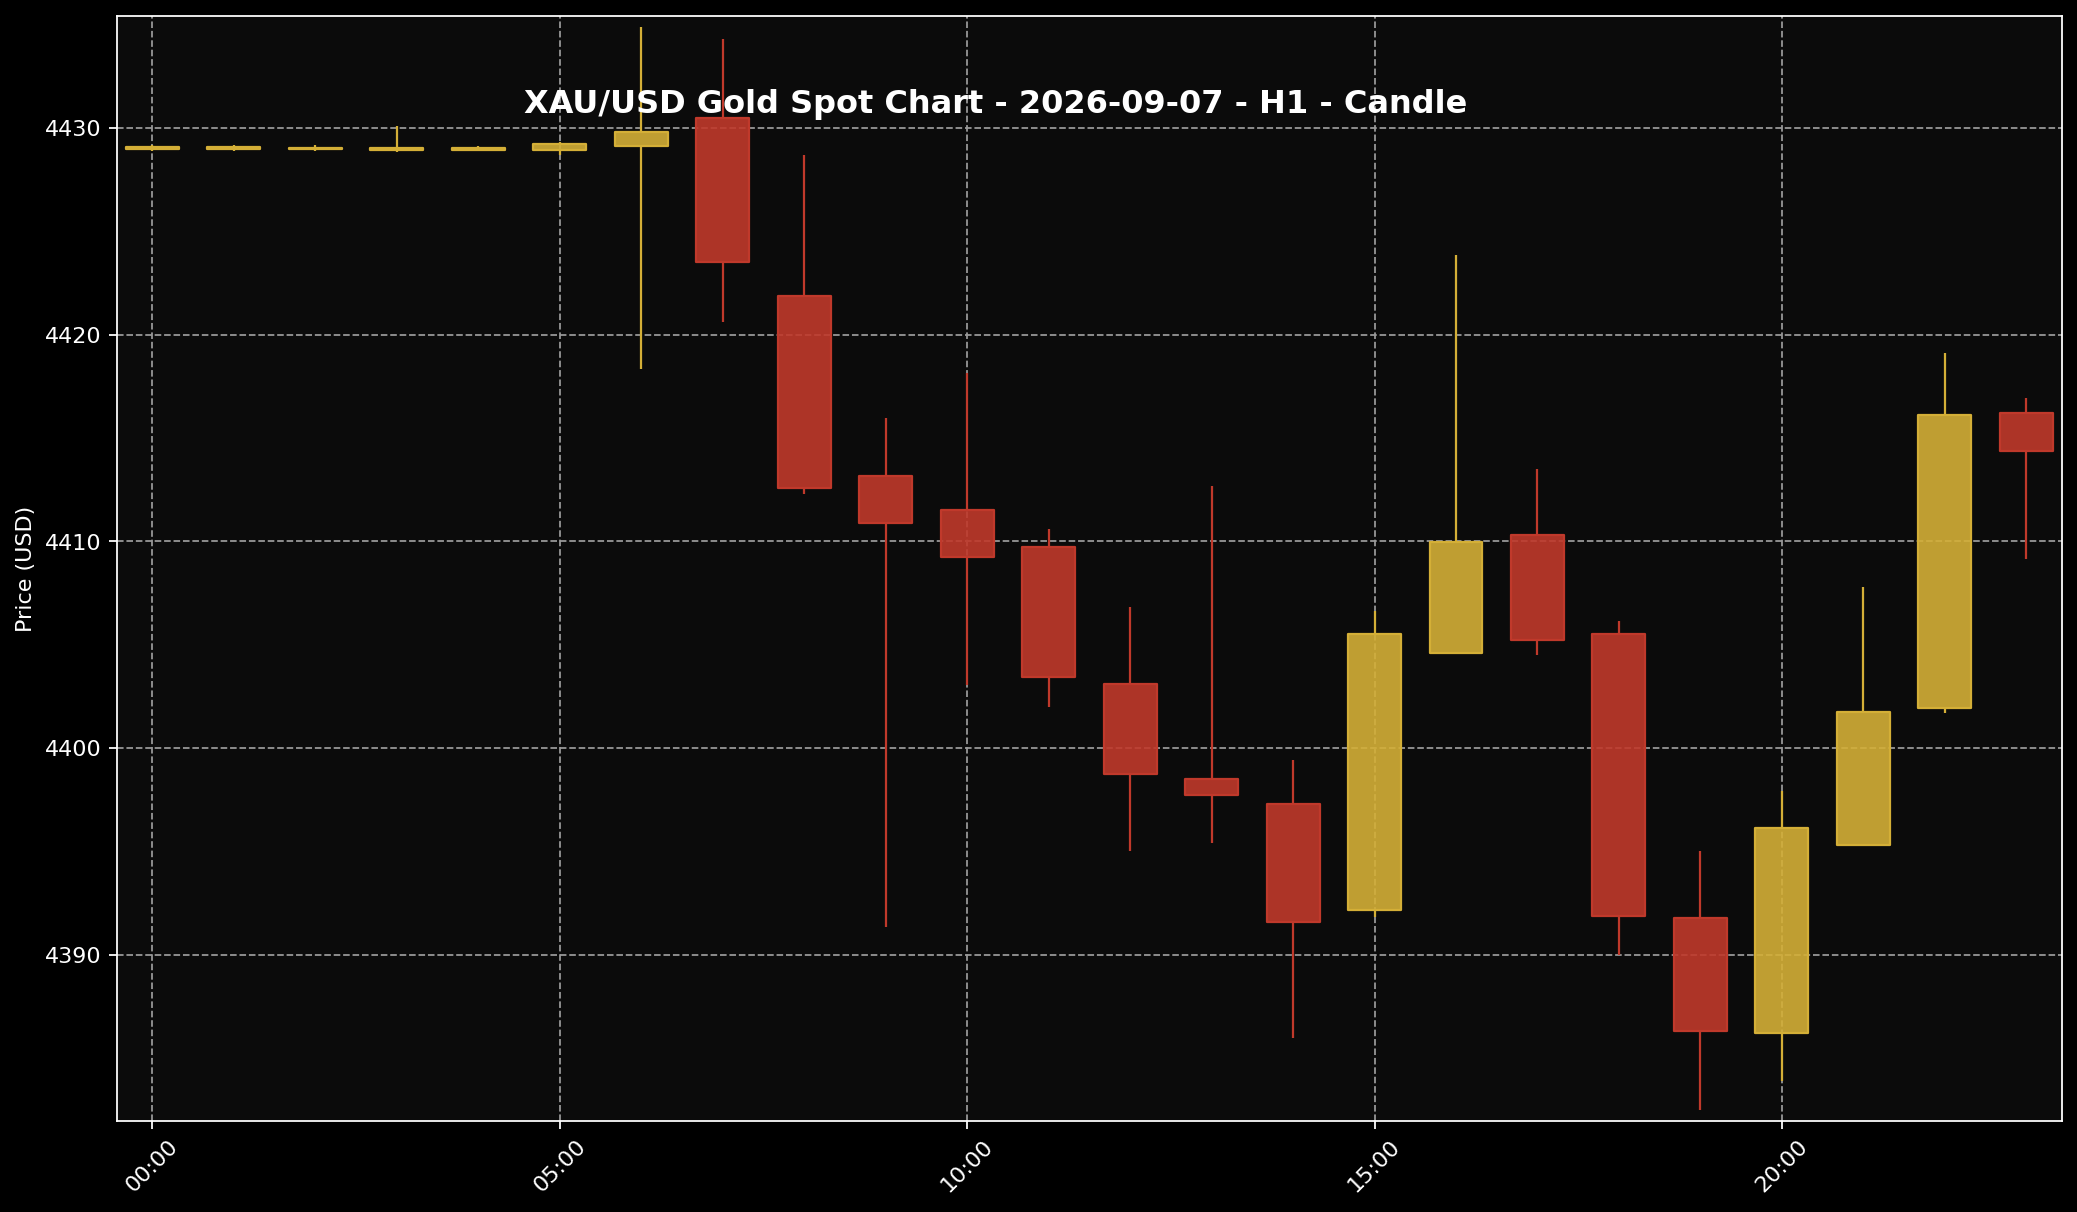 This chart shows the XAU/USD movement for the 7 September 2026 market session. Sifu Gold uses it as a visual reference, not a cue to buy emotionally.
1. Around 11:00 PM Malaysia time, global spot gold, based on XAU/USD, was around USD4,414.36 per troy ounce. In gram terms, that was about USD141.92 per gram. Using the USD/MYR rate of around 4.04593 at the same reference time, that worked out to roughly RM17,860.19 per troy ounce, or about RM574.22 per gram.
2. These Ringgit numbers are global spot conversions. They are not the same as the local physical retail gold price in Malaysia. Physical gold pricing can move differently because it includes other layers such as the exchange rate, product premium, buy-sell spread, operating cost, logistics and the local pricing structure at the time.
3. The main story for the day was that gold was pressured after strong US jobs data. When the market sees the US economy still looking firm, the Fed rate story comes back into focus. Gold usually finds that environment harder because it does not pay interest, unlike bonds or other interest-bearing assets.
What Is The Gold Chart Showing?
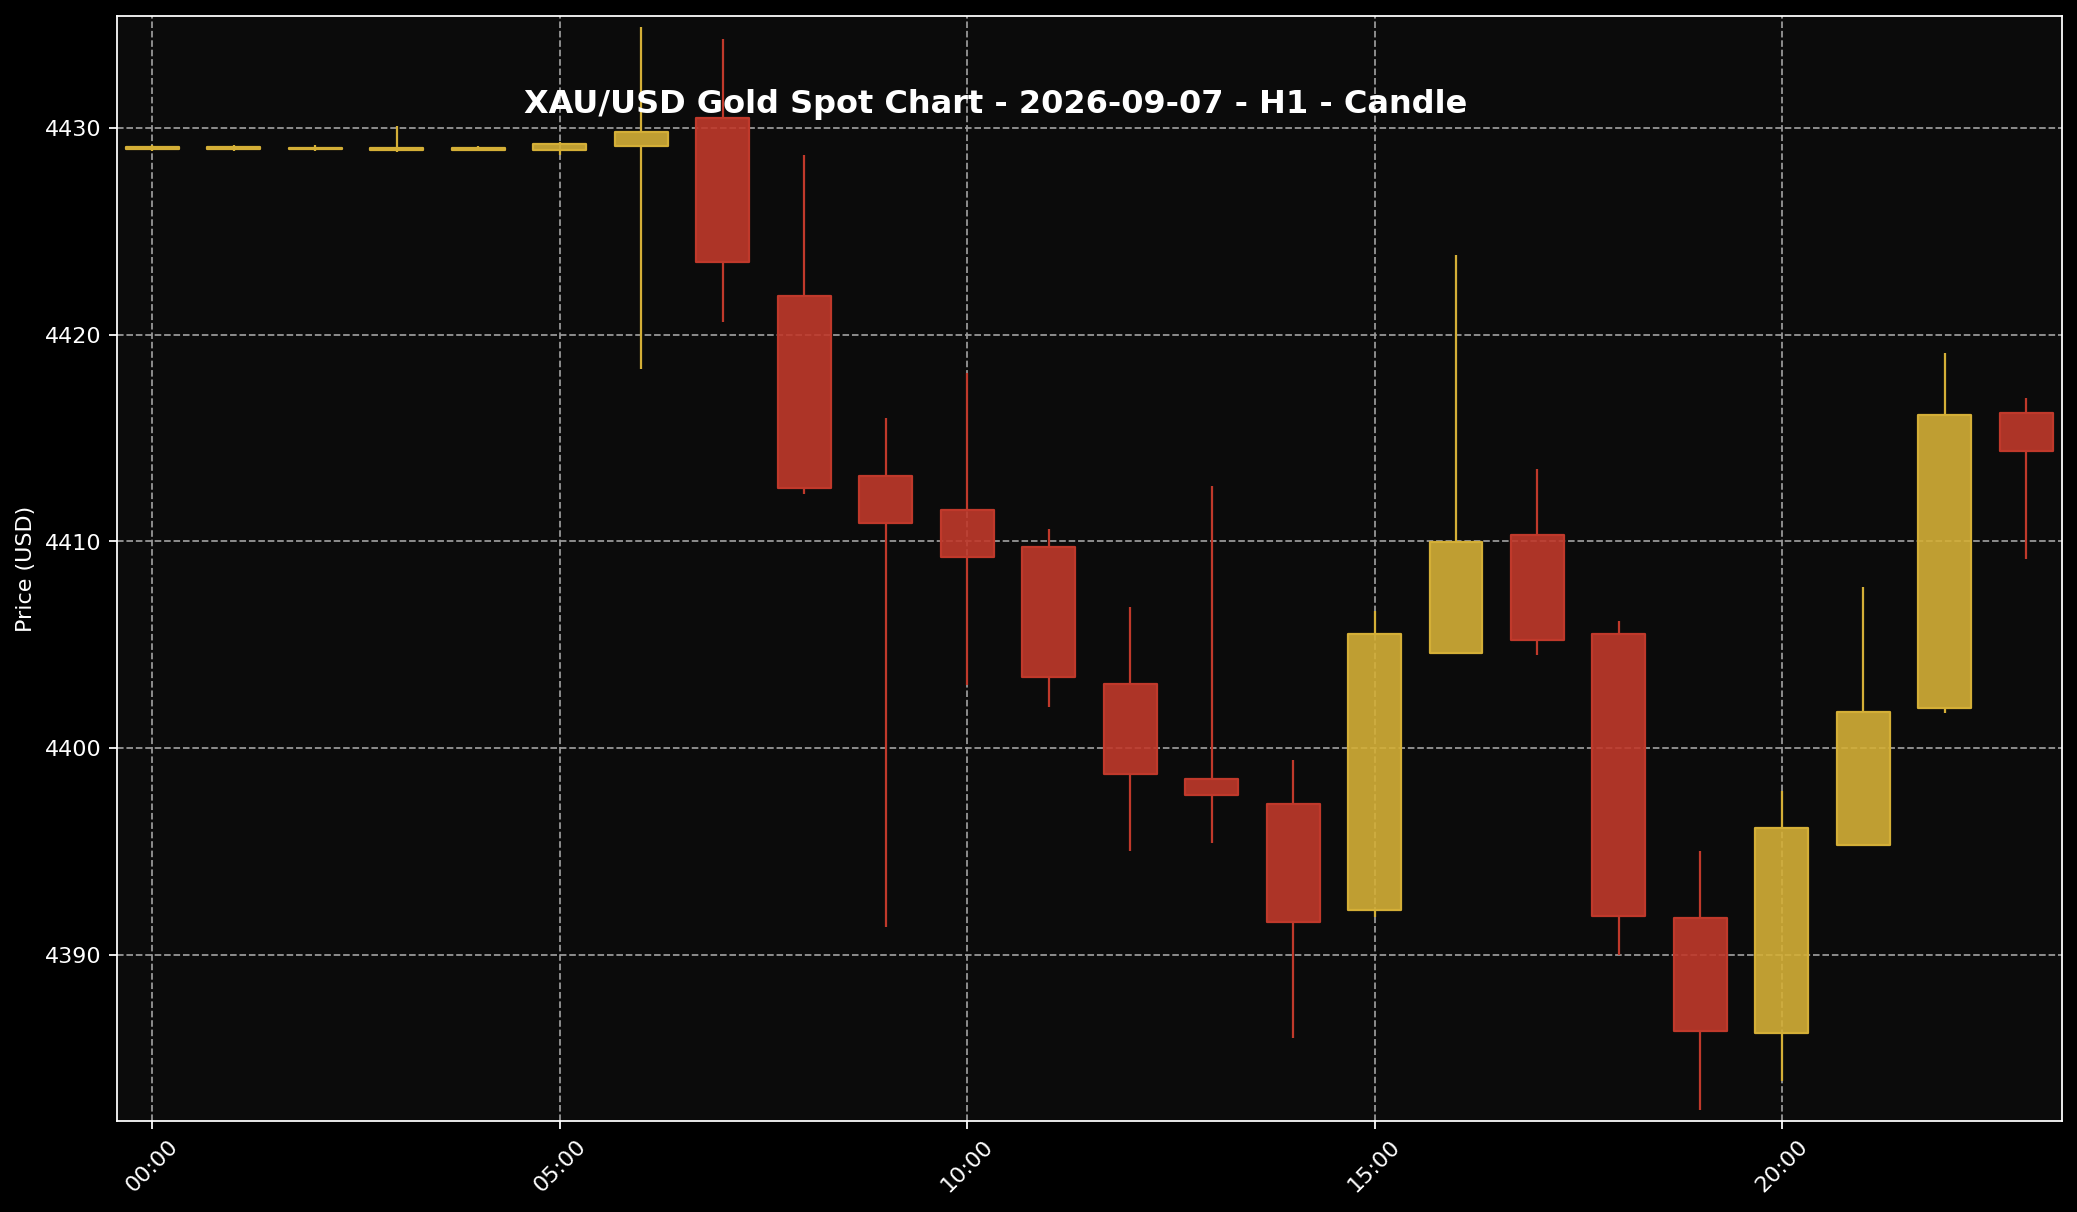 This chart helps readers see the gold price structure for the 7 September 2026 market session. It is used as market context and price-structure reference only.
1. Looking at the H1 gold chart for 7 September 2026, gold started around the higher area, near USD4,428 to USD4,430. Early in the session, the price still looked like it was trying to hold. But later, selling pressure came in, and several red candles pulled the price down towards the USD4,390 area.
2. The move was not a straight one-way fall into the end of the session. After the mid-session pressure, gold tried to recover a few times. There were visible rebounds, but each move higher still looked limited because the market was not fully comfortable with the US rate story.
3. So the cleaner chart reading is this: gold was still sensitive. There was pressure, there were recovery attempts, but there was no clean new direction yet. For normal readers, this is not something to read as a trading signal. It is simply a sign that the market was still reassessing US data, the Fed story and the next inflation reading.
Why Did Gold Move This Way?
 The US dollar is often one of the key factors influencing gold prices. When the dollar is firmer, gold can face more noticeable pressure.
1. The clearest trigger came from strong US jobs data. When employment numbers look firm, the market usually reads it as a sign that the US economy can still cope with higher interest rates. From there, expectations around the Fed can shift. Traders may start to think the Fed does not need to ease policy quickly, and may stay firm if inflation is still difficult to bring down.
2. When the rate story turns firmer, gold can come under pressure quite easily. The reason is simple. Large investors have choices. If US bonds look more attractive because they offer better returns, some money may move there first. Gold does not pay interest, so in the short term it can lose some appeal even though its role as a long-term store of value remains relevant.
3. At the same time, the market was also waiting for US inflation data. That made gold buyers more careful. If inflation stayed high, the Fed might find it harder to change its tone. If inflation cooled, some pressure on gold could ease. That is why the move on 7 September 2026 looked like a market that was not ready to make a big decision too early.
What Does This Mean For Gold Savers?
 For Malaysian gold savers, the key point is to understand the gap between global spot price and local physical price, then act according to budget and discipline.
1. The way I see it at Sifu Gold, daily gold movements are better used as a check-in point, not as a reason to react emotionally. When gold is pressured by US data and the Fed rate story, Malaysian gold savers are seeing the effect of global factors. This is normal in the gold market, especially when US interest rates are strongly shaping price direction.
2. One thing is worth keeping clear. XAU/USD is not the same as the local physical gold price in Malaysia. XAU/USD is the global gold price in US dollars. When converted into Ringgit, the reference was around RM574.22 per gram for global spot gold. But local physical prices can differ because of premium, spread, product type, operating cost, logistics and current local pricing updates.
3. If you already have a monthly gold-saving budget, staged buying still makes more sense than trying to catch the lowest price perfectly. Split the budget, check your commitments, and keep your emergency fund intact. If this month’s budget is tight, there is no need to force it. Waiting until the price and your own cash flow look more organised can also be a disciplined decision.
Conclusion
For 7 September 2026, the main gold story was shaped by strong US jobs data. That data pushed the market back towards the Fed rate discussion. When rates are expected to stay high, or when the Fed is seen as still having room to stay firm, gold can struggle because investors compare it with assets such as US bonds that pay a return. For Malaysian gold savers, the focus is not to chase one daily price. The better approach is to understand the market story, compare global spot gold with local physical pricing, and follow your own saving plan. If you want to start small, the Gold Accumulation Program by Public Gold lets you begin saving gold from as low as RM100, based on your own affordability and without committing the full budget at once.

