


What happened to gold on 8 September 2026? It was not a clean one-way session. Early on, gold had some support as the US dollar eased and the market waited for US inflation data. But later, the pressure came back. Oil prices moved higher, US Treasury yields stayed elevated, and traders started looking again at what the Fed might do with interest rates. For Malaysian gold savers, this is a useful reminder: gold does not move because of one headline alone.
- Introduction
- What Happened To Gold On 8 September 2026?
- What Is The Gold Chart Showing?
- Why Did Gold Move This Way?
- What Does This Mean For Gold Savers?
- Conclusion
What Happened To Gold On 8 September 2026?
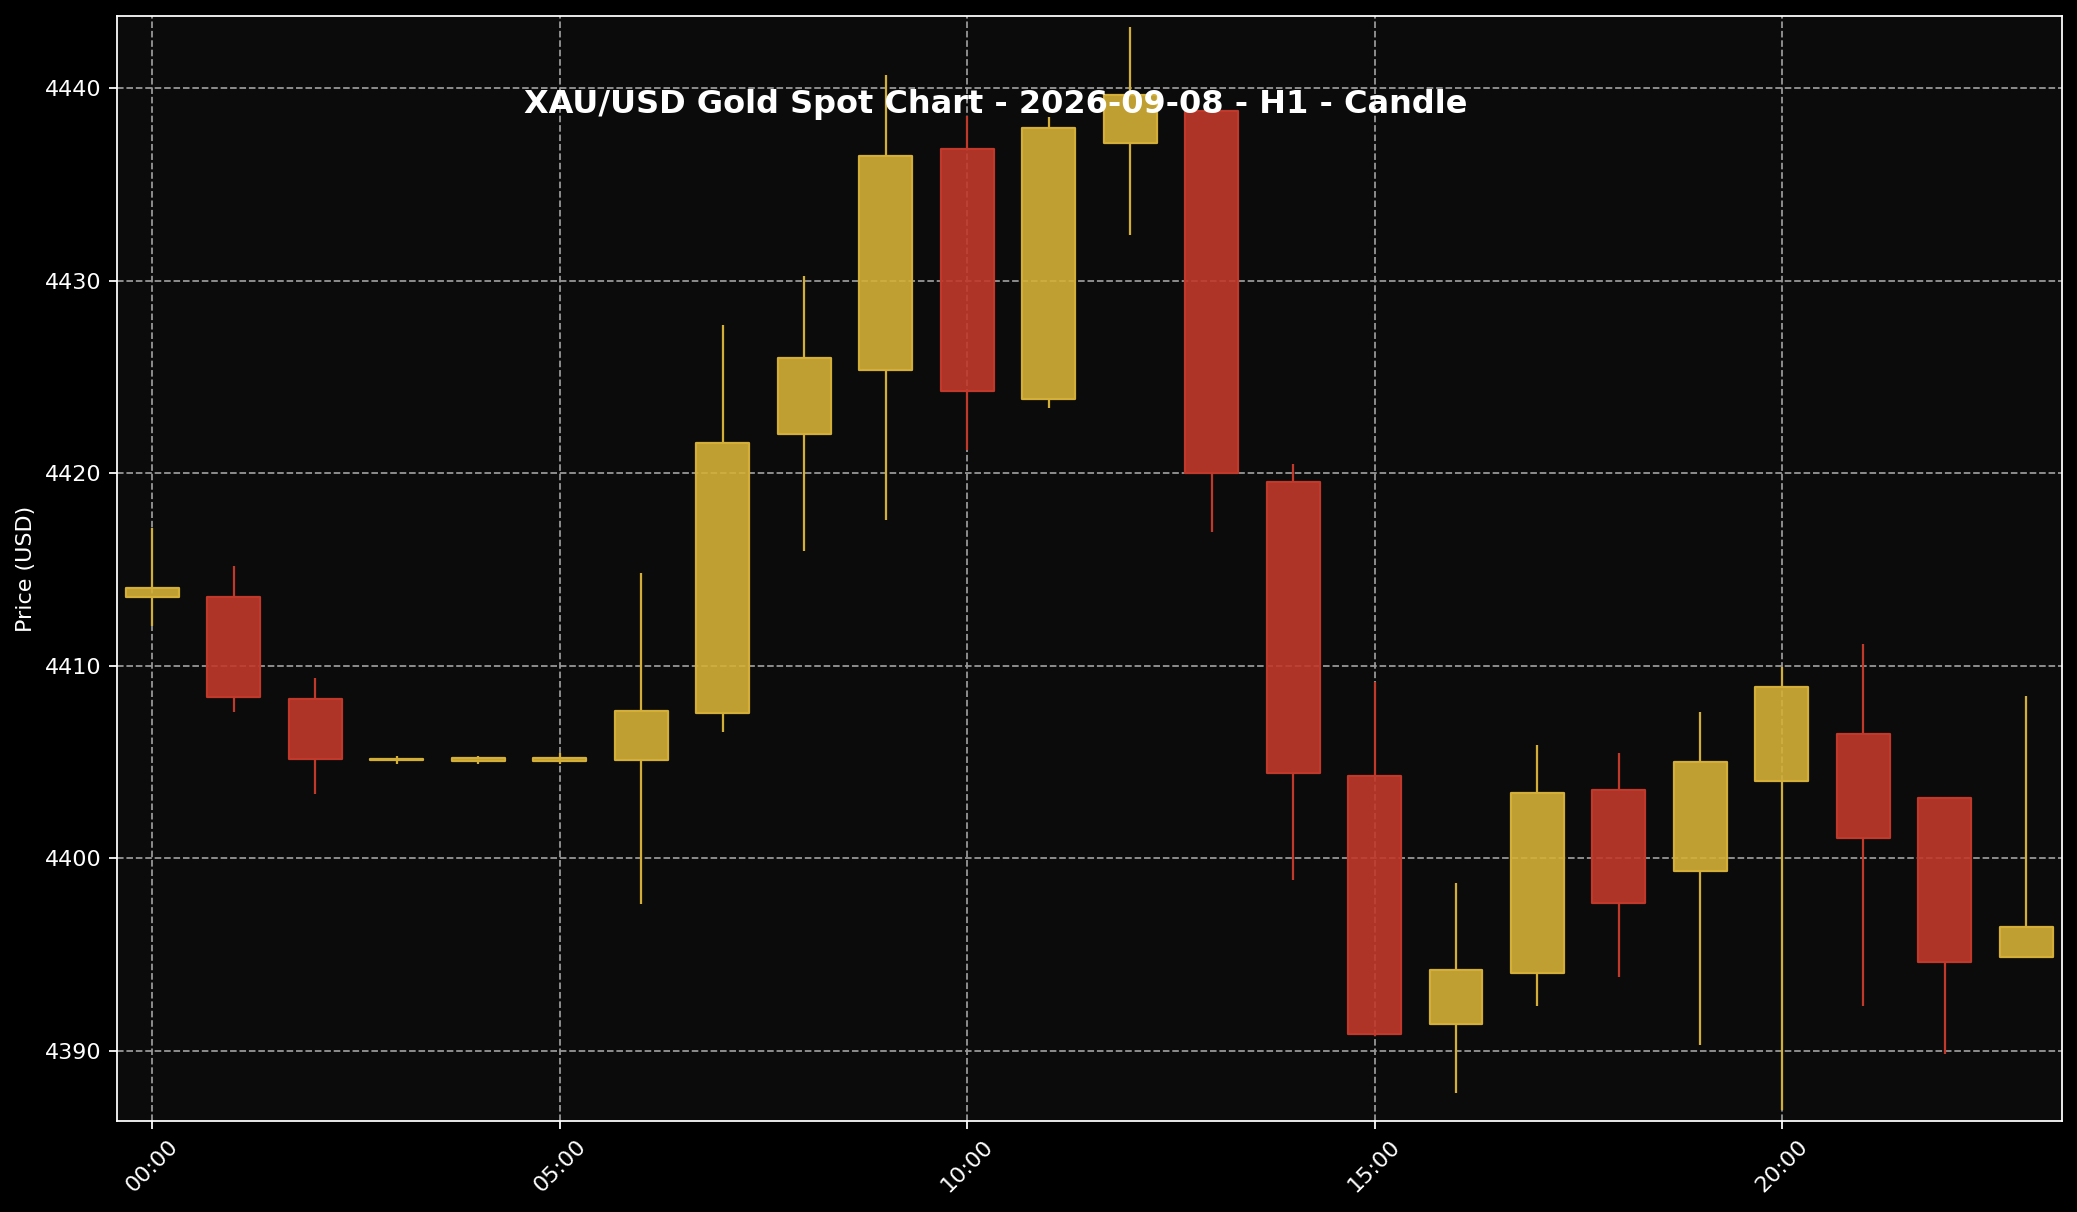 This chart shows the XAU/USD movement for the 8 September 2026 market session. Sifu Gold uses it as a visual reference, not a cue to buy emotionally.
1. Around the 11:00 PM Malaysia time reference snapshot, XAU/USD was around USD4,396.42 per troy ounce. Broken down into grams, that was roughly USD141.35 per gram. Based on USD/MYR around 4.06325 at the same snapshot time, the global spot value translated to about RM17,863.77 per troy ounce, or around RM574.33 per gram.
2. These Ringgit figures are global spot conversions. They are not the same as the local physical gold price that a buyer may see in Malaysia. The spot price helps us understand the global market direction, but local physical pricing has other layers too, such as currency movement, product premiums, buy-sell spread and local pricing structure.
3. The main point is that gold did not manage to keep moving higher smoothly. It had early support when the US dollar eased, but later the market focus shifted. Higher oil prices, elevated US bond yields and renewed attention on the Fed rate path made it harder for gold to hold its early strength.
What Is The Gold Chart Showing?
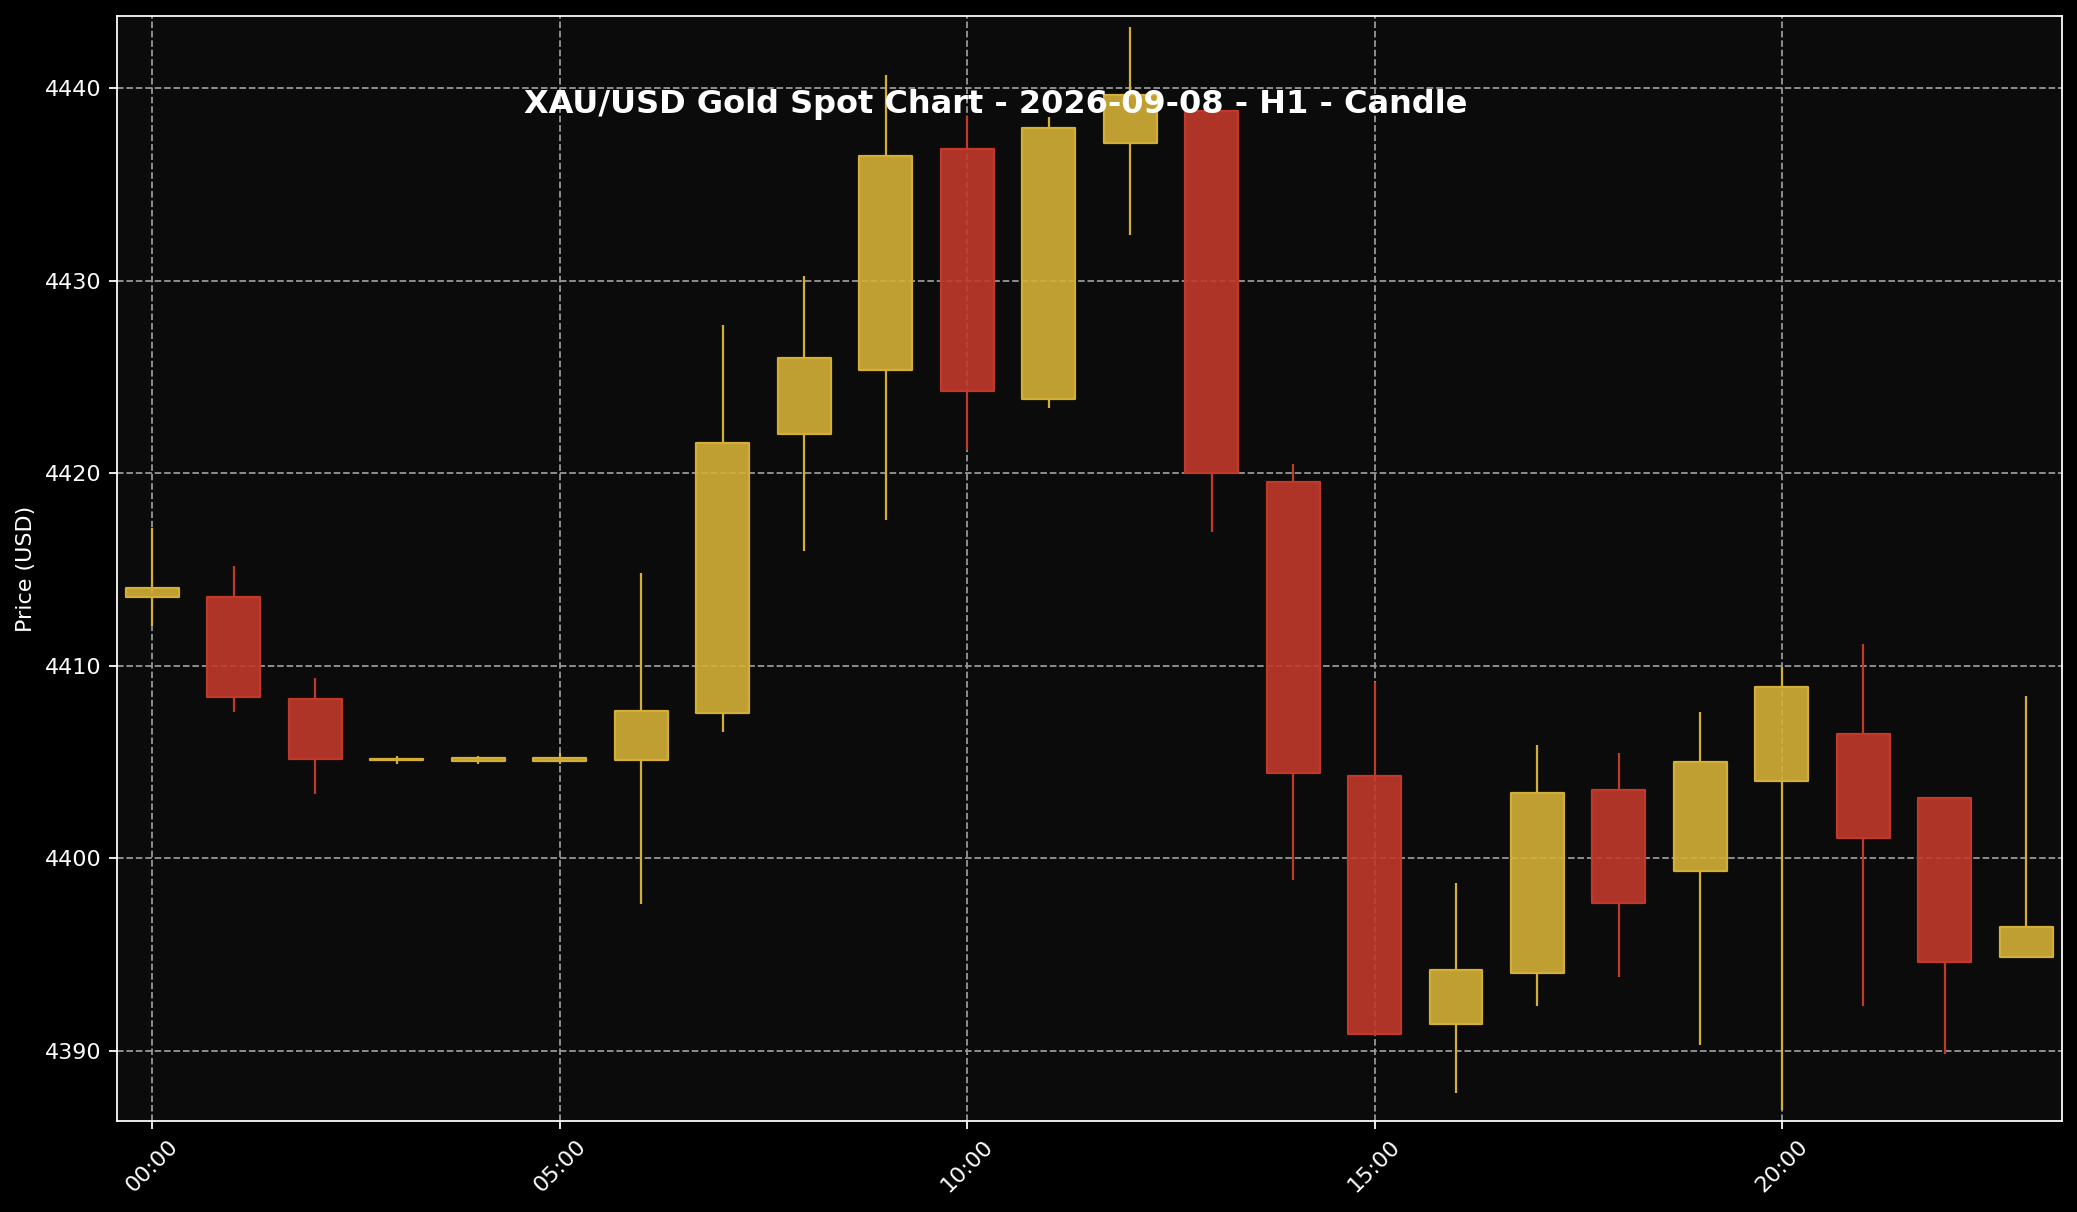 This chart helps readers see the gold price structure for the 8 September 2026 market session. It is used as market context and price-structure reference only.
1. If we look at the H1 chart for 8 September 2026, gold started around the USD4,410 to USD4,415 area, then pushed higher towards the upper USD4,440 zone. That tells us buyers were still trying to lift the price earlier in the session. So the day did not begin with gold looking weak from the start.
2. But after that higher zone, the chart started to show clearer selling pressure. Gold moved back down towards the USD4,390 area before trying to settle into a smaller range. Put simply, the chart showed gold rising first, then getting pushed back, then trying to find its footing again.
3. For Sifu Gold readers, the chart is not a buy or sell signal. Its job here is just to help us see the structure of the day. The cleaner reading is this: gold had early strength, but the market did not have enough follow-through to keep that strength going once the oil, yield and Fed story became more important.
Why Did Gold Move This Way?
 The US dollar is often one of the key factors influencing gold prices. When the dollar is firmer, gold can face more noticeable pressure.
1. The early support came from the US dollar. Gold is priced globally in US dollars, so when the dollar eases, gold can become a little easier for non-US buyers to absorb. That is why gold managed to gain some ground earlier while the market was watching upcoming US inflation data.
2. But the story changed when traders turned back to oil, US Treasury yields and the Fed. When oil prices rise, the market can worry that inflation may stay sticky. If inflation looks harder to bring down, traders may start thinking the Fed has less room to loosen policy, or may need to keep a stricter stance for longer.
3. This matters for gold because gold does not pay interest. When US bond yields are high, some investors may find bonds more attractive for the time being. At the same time, US-Iran tensions still gave gold some safe-haven support, but on this session that support was not strong enough to cancel out the pressure from oil, yields and Fed expectations.
What Does This Mean For Gold Savers?
 For Malaysian gold savers, the key point is to understand the gap between global spot price and local physical price, then act according to budget and discipline.
1. The way I read it at Sifu Gold, daily gold movement is better used as a check-up point, not as a reason to react emotionally. The 8 September 2026 session showed that gold still had support in the background, but the market can change direction quickly when interest rates, oil and bond yields return to the front of the story.
2. For Malaysian gold savers, looking at XAU/USD alone is not enough. Global gold is quoted in US dollars, while we think, save and spend in Ringgit. On top of that, physical gold in Malaysia is not priced exactly like global spot gold because local physical prices can include premiums, spread, product costs and local market adjustments.
3. So what can a saver do? Start with the budget. If you already have a monthly gold-saving plan, small staged buying can still make sense when it fits your cash flow. If the month is tight, there is no need to force it. I prefer building grams according to a plan, rather than committing the full budget at once just because gold moved for a day or two.
Conclusion
In short, gold on 8 September 2026 moved through a mixed session. It had early support as the US dollar eased, but later the pressure from higher oil prices, elevated US bond yields and Fed rate expectations took over. That is why gold struggled to keep rising, even though geopolitical tension was still sitting in the background. For Malaysian gold savers, the most useful approach is to read all the layers together: global spot price, USD/MYR, local physical pricing, spread and personal budget. If you want to start small, the Gold Accumulation Program by Public Gold allows you to begin saving gold from as low as RM100. The idea is not to chase every daily move, but to build grams bit by bit according to what you can afford.

